Emacs Extensions for
GE Smallworld Magik Development
Screen-casts, tutorials, and productivity tools for Magik programmers who use Emacs. From tab-mode and code folding to the Magik Debugger and object inspector — explore features built by a developer, for developers.
Learn MoreNine screen-casts published between November 2010 and January 2011 — covering everything from ECB mode to the Tree Item GUI control. Read the story behind the project →
Get in Touch
Exploring Magik objects with Edebug and Inspector in Emacs
Magik programmers who maintain GE Smallworld installations across Australian utilities spend a lot of their day peering inside objects. From Sydney Water treatment plant schemas to the distribution networks that Ausgrid manages along the eastern seaboard, the data models that Smallworld exposes are deep, recursive and constantly evolving. Two Emacs facilities sit at the centre of any serious investigation: Edebug for stepping through Magik code line by line, and the Inspector buffer for browsing live object state. Used together, they shorten the gap between a failing method and the slot value that caused the failure.
The pair also scales nicely across the rest of the local Smallworld footprint, including gas distribution modelling for APA Group in Melbourne and asset recording work for Essential Energy in regional New South Wales. Once a developer learns to instrument a method, set a conditional breakpoint and pop into an object view mid-step, the same workflow applies whether the Magik session is connected to a Brisbane production database or a small test fixture on a laptop in Adelaide. This article walks through practical setups, useful key bindings and patterns that have proven themselves in Australian consulting engagements.
Wiring Edebug into a Magik source buffer
Edebug needs three things before it becomes useful for Magik: an instrumented definition, a way to reach that definition from a running session, and a comfortable editing layout. The simplest entry point is M-x eval-defun on a freshly written method, followed by C-u C-M-x to instrument the same definition for debugging. Once instrumented, the source buffer is shaded with little arrows and the next call into that method from any process, including a Smallworld Magik session, an Inferior Magik buffer or a test runner, will halt at the first line.
Breakpoints are placed with the b key on any line of an instrumented definition. Conditional breakpoints can be created with the prefix C-u b, which prompts for a Magik expression evaluated each time execution reaches the line. A common Australian pattern is to guard the breakpoint on a particular dataset identifier or a record id that matches a Sydney region code, so the developer only stops for the records they actually care about. Other useful keys are SPC to step one form, n to step over, g to go to the next breakpoint, and q to abort and return to top level.
When the stepper halts, the Edebug mode line shows the current Magik form, the surrounding method and the recursion depth. From here it is worth opening a small window configuration that keeps the source on the left, an *Edebug* log buffer below it and a scratch Magik buffer on the right. The scratch buffer becomes the place to call inspectors, evaluate expressions and inspect intermediate results without leaving the session. Splitting the frame this way keeps the workflow tidy across dual monitors, which is how most Smallworld consultants in Melbourne and Perth set up their desks.
Browsing live object state in the Inspector
The Inspector is what turns a paused execution into something readable. With Edebug stopped on a line, the developer can press M-x inspect on any expression visible in the source buffer, or type i to inspect the value under the point. Emacs then spawns a dedicated buffer that lists every slot of the target object, the slot's value, and the class hierarchy leading back to object. Clicking or pressing RET on a slot value re-enters the inspector recursively, so a developer can walk down through a Smallworld RWO chain into its geometry, its owning collection and back up to its region record without leaving the keystrokes behind.
The most useful feature for Magik work is the ability to inspect a value that itself contains references to other objects. A rope_collection or indexed_collection appears as a paginated list, and pressing n or p walks through its elements. For very large collections, the prompt at the top of the inspector accepts an integer that sets how many elements are shown per page, which keeps memory usage sane when a developer is examining a continent-wide asset register from a Perth office. The same approach works for the result of dataset.alphabet(), where the underlying class can be confirmed before any code is written that depends on it.
Because the Inspector shows values, not types, an Australian developer often uses it to verify that a particular field carries the expected coord geometry after a coordinate transformation, or that a string field carries an AEST timestamp rather than UTC. Magik stores timestamps as date objects, and the Inspector prints them in a readable form, removing one of the small frustrations that come up during data migration work for utilities based around Sydney and Brisbane.
Navigating methods while the stepper is paused
One of the underrated strengths of Edebug is that it does not freeze the editing environment. From inside a halted step, M-. jumps to the source of any symbol visible in the current form, including the callee of a method invocation. For Magik, this means a developer standing on a call to record_owner.update() can hop into the Smallworld core to see what the update actually does, then hop back. M-, returns to the previous point. The combination makes the source-level debugger a navigation tool as much as a stepping tool, which matters when working across a code base that mixes custom utilities code, Smallworld product code and third-party plug-ins.
Imenu support, exposed with M-x imenu, lists every method in the current Magik file grouped by class. When Edebug stops inside a method whose definition is not in the current file, M-. still finds it by following the Magik loader's path search, and a fresh window pops up next to the stepper. Australian teams that work across multiple repositories, such as a Sydney consulting team shipping custom modules for one client and a separate codebase for another, benefit from setting up a dirvars configuration so each project carries its own sw_path and source path, ensuring M-. always lands somewhere sensible.
The third navigation pillar is C-x C-e and C-M-x from inside the Edebug buffer. These evaluate Magik forms in the paused frame, which means a developer can change a local variable, swap a slot value and continue stepping to test the new state. It is a polite way to mutate-and-watch without recompiling anything. For a Melbourne team working on a custom banded report, this lets them flip a flag on a Magik sw!symbol!collection between steps and watch the rendering change in a side window without ever leaving Emacs.
Inspecting collections and database sessions
Smallworld work lives or dies by collections and database sessions, and the Inspector handles both gracefully. A database_session value inspected from inside Edebug shows the current transaction, the isolation level and the list of open datasets. Each dataset slot can be expanded to reveal its alphabet, its indexes and the active cursor, which is exactly the level of detail needed when chasing a slow query in a production system running out of Brisbane or Adelaide.
For collections specifically, the pattern is to inspect the collection head, then use the numeric page argument to step through elements in batches of twenty or fifty. Each element can be inspected on its own to show its own slots, so an entire nested structure becomes readable in a tree-like form. When a developer wants to know whether a value is the same instance that was passed in earlier, evaluating eq?(current_value, saved_value) in the Edebug buffer returns a true or false Magik boolean, which prints as true or false and gives a quick answer without additional navigation.
Date and time fields deserve a note. Because Australia spans AEST, ACST and AWST, and because daylight saving pushes Sydney and Melbourne an hour ahead between October and April, a timestamp recorded in one office can look an hour off when read from another. The Inspector renders date values in their raw internal form, and a quick evaluation of date.now() in the Edebug buffer shows the current Magik time. Combining those two pieces of information is the fastest way to spot a timezone bug during a multi-site rollout, especially when a developer in Sydney is debugging data prepared overnight by a batch job running in Perth.
Tuning the setup for Australian consulting workflows
A few local customisations make the Edebug and Inspector combination more pleasant to use across Australian time zones and team structures. First, set up magik-customization-alist so that Edebug instrumentation honours the project's Magik version, since Smallworld 5.x Magik behaves slightly differently from Smallworld 4.x Magik when stepping through block constructs, and a misaligned source line throws the stepper off. Second, configure a project-specific source path so M-. resolves symbols against the local repository rather than the product source tree.
Third, log everything. HydePark Consulting's engagements across Australian utilities tend to leave a paper trail, and Edebug's edebug-on-error flag combined with a small Magik wrapper that records session id, user, AEST timestamp and current method gives a durable record. The Inspector buffers can then be saved with C-x C-w into a folder named after the incident, which doubles as documentation. Finally, bind C-c d to edebug-defun so instrumentation is a single keystroke away from anywhere in the source buffer.
When the workflow is dialed in, the time between a reported defect and a confirmed root cause drops sharply. A Sydney-based consultant working on a network model for Ausgrid can step into a failing rule, inspect the RWO under evaluation and confirm in seconds whether the geometry is in the expected projection. A Melbourne developer chasing a billing report discrepancy can inspect the data fetched by the report generator, see the underlying record and rerun the same Magik expression in the Edebug buffer to reproduce the bad result locally. That kind of tight loop is the daily bread of Smallworld consulting work, and Emacs remains the most comfortable place to do it in.
If you would like screencasts of these workflows in action, subscribe to the Magik Emacs channel and follow the HydePark Consulting updates page. Custom Emacs configurations for Smallworld teams in Sydney, Melbourne and Brisbane are available on request, along with on-site training sessions that walk through the same scenarios covered here against a real Australian Smallworld dataset.
Core Features
Tab Mode & ECB
Quick tab switching and Emacs Code Browsing mode for navigating Magik codebases efficiently.
Magik Smeller
Code analysis tool that helps identify potential issues in Magik source files.
Code Folding
Hide/Show mode for collapsing and expanding Magik code blocks to focus on what matters.
Visual Bookmarks
Quick visual bookmarks for jumping between key locations in your Smallworld session buffers.
Object Inspector
Inspect Magik objects and display them in an Emacs Deep Print buffer for detailed examination.
Magik Debugger
Set breakpoints and monitor slots and variables directly from within Emacs.
Development Tools
Direct links between Emacs and the Smallworld Development Tools application, including Click Monitor.
Screen-casts & Tutorials
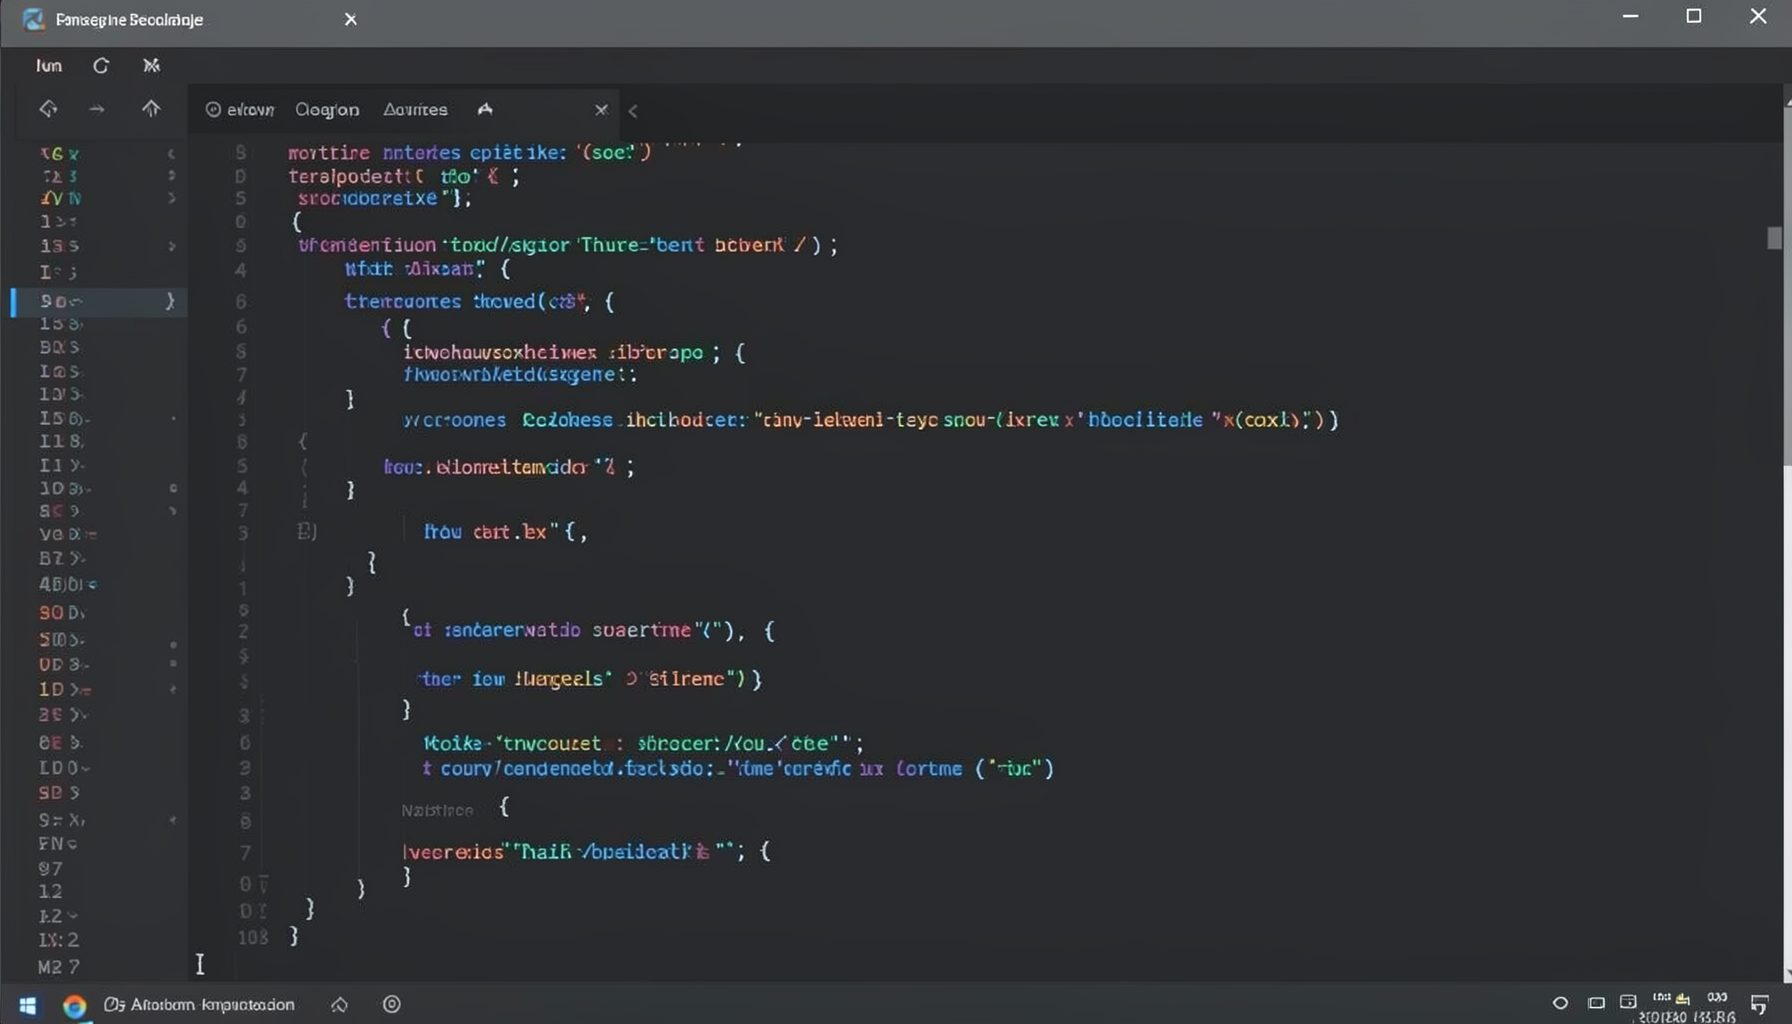
Screen-cast 1: Tab Mode, ECB & More
Covers tab-mode, ECB, Magik Smeller, code folding, visual bookmarks, pragma toggling, moving code, external editor, and MS Explorer.
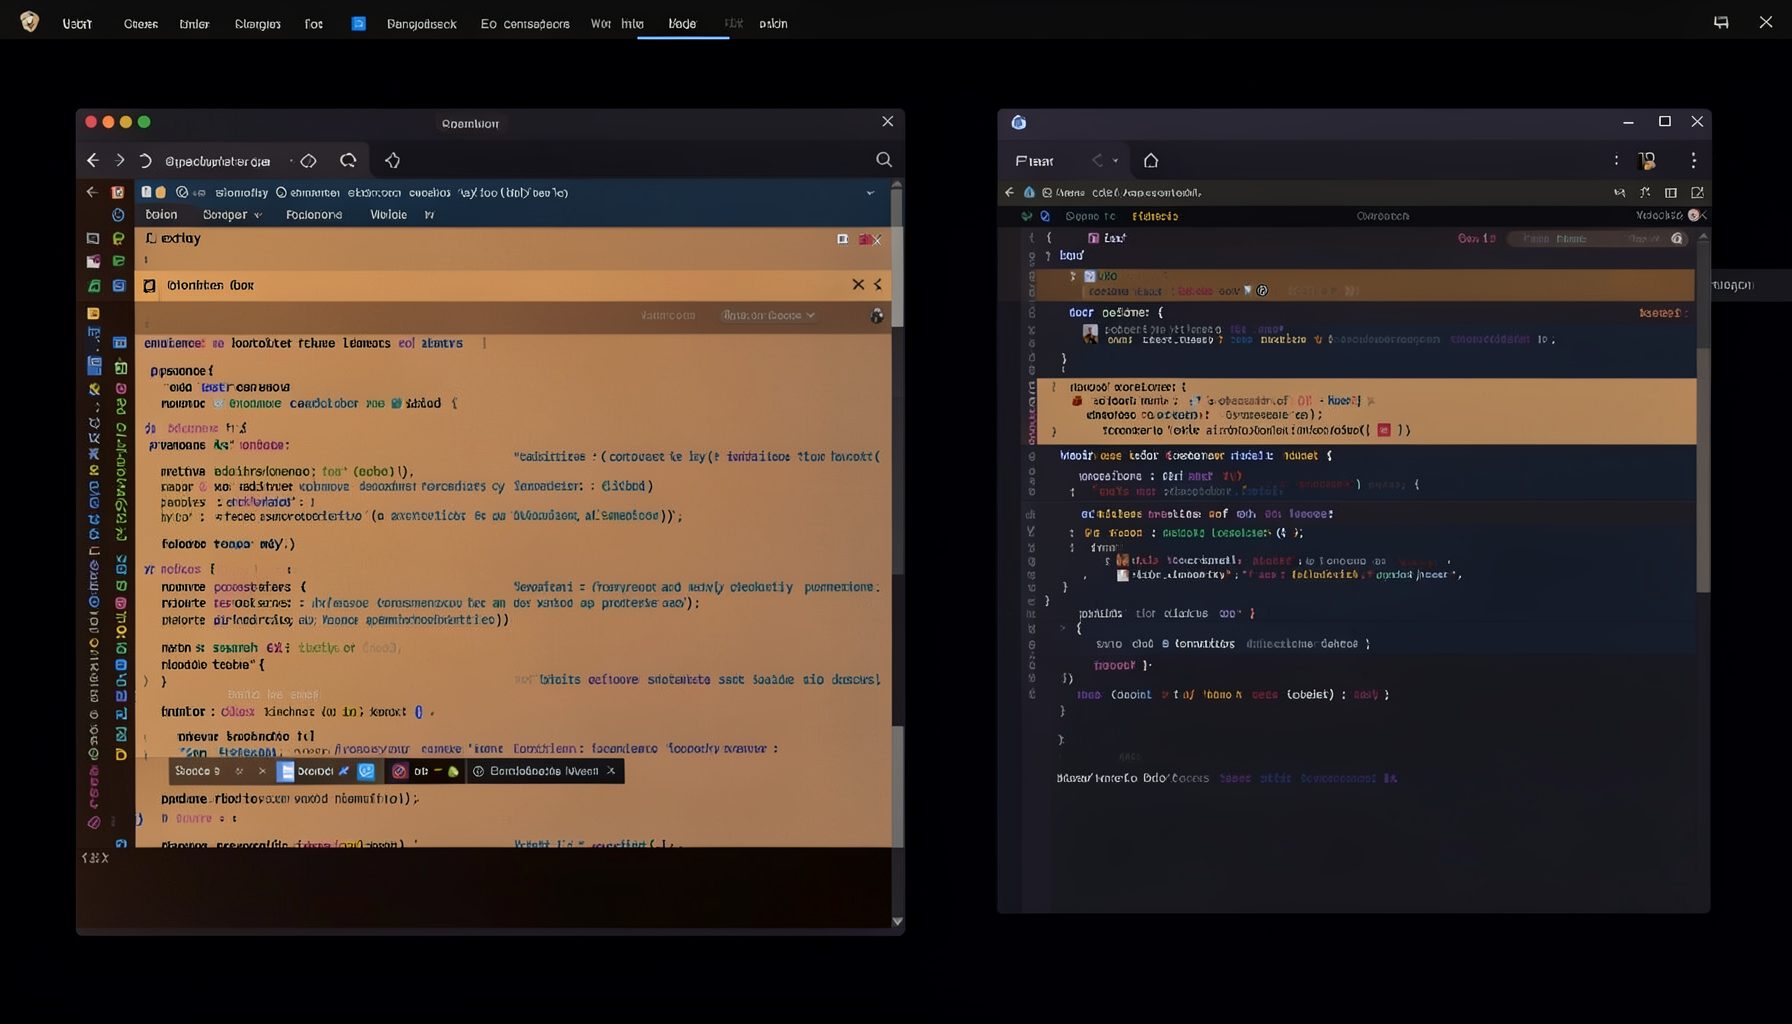
Screen-cast 5: Object Inspection & Deep Print
Inspect a Magik object, prompt for an expression evaluated within a Smallworld session, and display results in a Deep Print buffer.
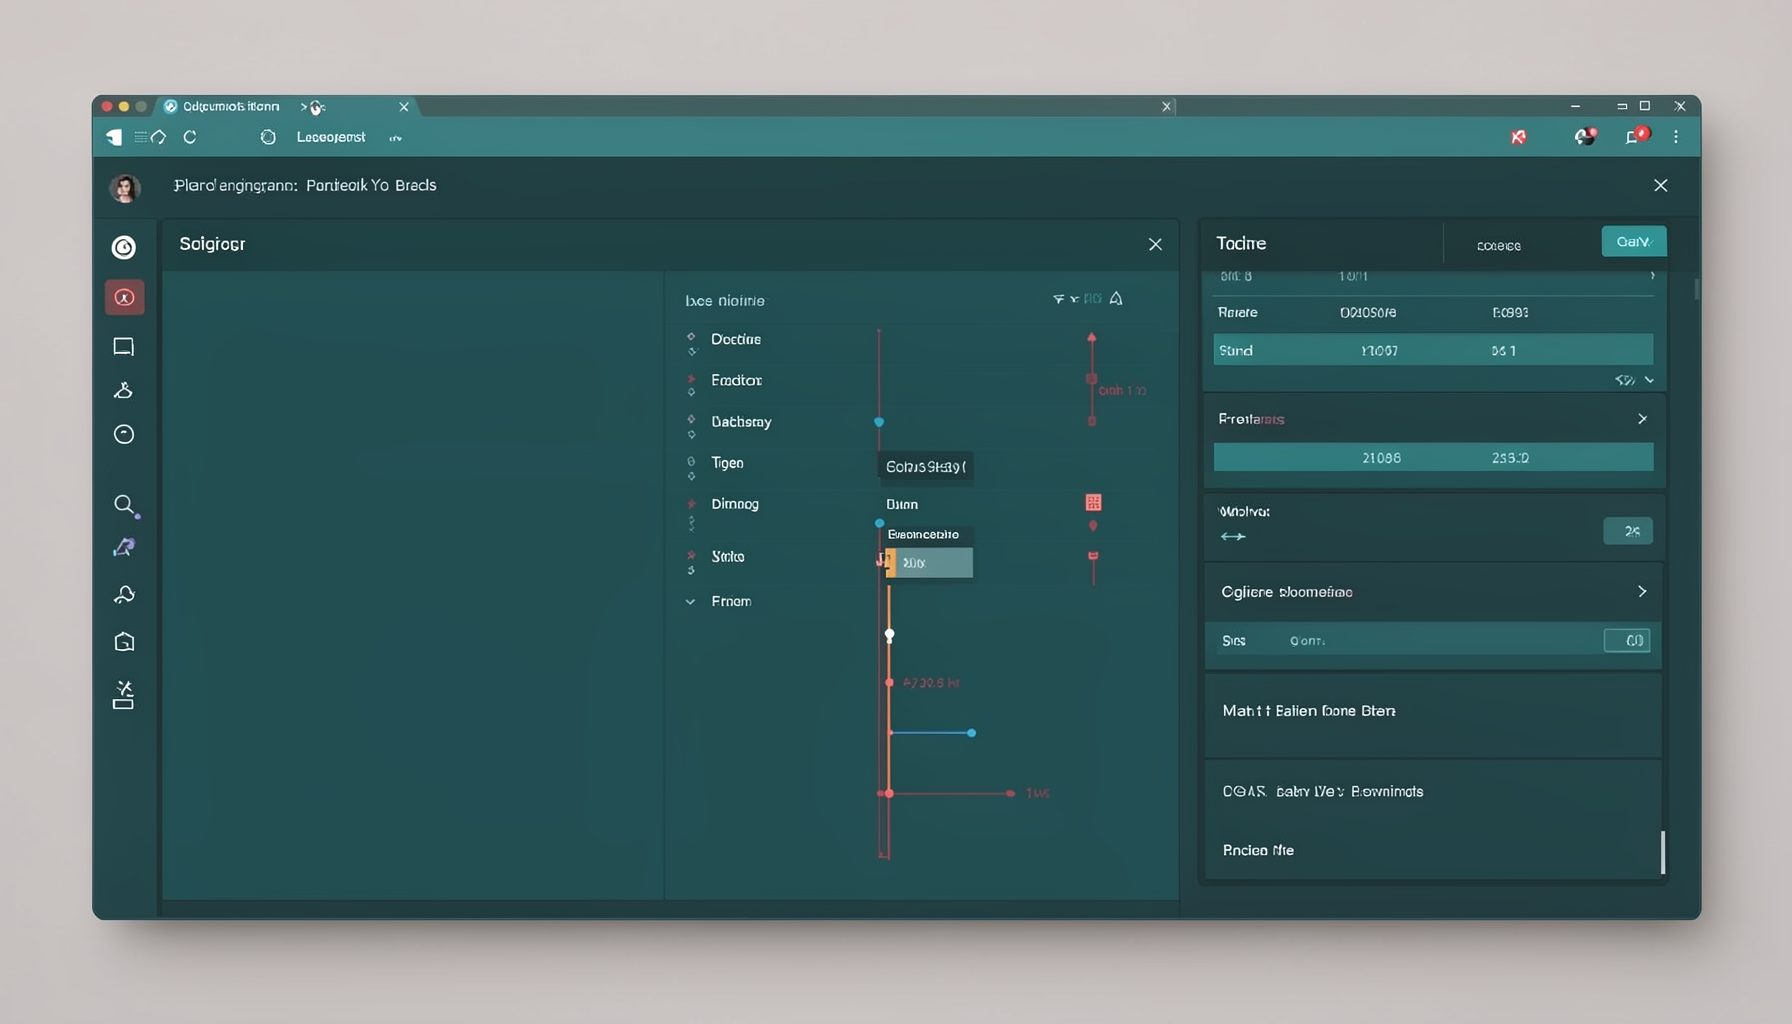
Screen-cast 7: Magik Debugger
Useful tools for application developers: Object Inspector and Magik Debugger with breakpoints and slot/variable monitoring.

Screen-cast 9: Tree Item GUI Control
Tree Item is a GUI control providing extensive facilities for displaying lists with rows, columns, trees, and in-place editing.