Emacs Extensions for
GE Smallworld Magik Development
Screen-casts, tutorials, and productivity tools for Magik programmers who use Emacs. From tab-mode and code folding to the Magik Debugger and object inspector — explore features built by a developer, for developers.
Learn MoreNine screen-casts published between November 2010 and January 2011 — covering everything from ECB mode to the Tree Item GUI control. Read the story behind the project →
Get in Touch
Setting Magik Breakpoints in Emacs
Debugging Magik becomes considerably easier when the editor, runtime and source code work together. Instead of scattering temporary print statements through a method, you can pause execution at a meaningful line, inspect the current object, and continue with a clearer view of what the application is doing.
For developers using GE Smallworld, this workflow is especially useful when investigating network data, record updates, application customisations or collection-processing code. Magik often operates across several layers of application logic, so a breakpoint can reveal the state that is difficult to infer from source code alone.
Emacs provides a productive control surface for this work. A Magik editing mode can help you move between methods, evaluate code, send commands to a running session and keep the relevant source visible while the debugger is active.
The exact key bindings depend on the Magik Emacs setup and the Smallworld runtime version. The principles remain consistent: start the correct session, place a breakpoint at a useful execution point, reproduce the problem, inspect the paused context and remove or refine the breakpoint when the investigation is complete.
Prepare The Magik Session
Before placing a breakpoint, confirm that Emacs is connected to the Magik session in which the code will run. A breakpoint belongs to a particular runtime process or debugging connection. Setting one in a source buffer while another Smallworld session is executing will produce confusing results, especially when several development environments are open.
Load the relevant module and make sure the source file in Emacs matches the code loaded by the runtime. If the method has changed since the session started, reload it or restart the development session according to your team’s normal procedure. This avoids a common false lead: the debugger appears to skip a breakpoint because the running method is an older definition.
The Magik Emacs resources provide context for editor integration, source navigation and related development workflows. In a consulting team working across Sydney, Melbourne and Perth, documenting the expected connection process is valuable because developers may use different local installations, Smallworld versions or remote environments.
Find The Right Method
A useful breakpoint begins with a useful location. Start at the method where the unexpected value is first visible, rather than automatically stopping at the top of a large transaction. Method navigation in Emacs can help you move from a caller to a suspected callee and identify the point where control enters the relevant business rule.
Look for boundaries where the program’s state changes. Examples include a method that filters a collection, constructs a record, updates a network feature or converts an external value into a Magik object. A breakpoint immediately before an assignment, conditional branch or collection operation often provides more information than one at the end of a long method.
When the source is unfamiliar, trace backwards from the visible symptom. If a result contains the wrong record, stop before the result is assembled. If a method raises an exception while iterating, stop inside the iteration and inspect the current element. This turns breakpoint placement into a hypothesis about the program, rather than a random pause in execution.
Set A Breakpoint From Emacs
In an integrated Emacs workflow, place point on the executable line or method where execution should stop, then use the Magik debugger command supplied by the mode. Some configurations expose a keyboard binding or menu entry; others provide an interactive command through M-x. Use M-x apropos-command with terms such as magik, debug or break when the local binding is unfamiliar.
A successful breakpoint is usually shown with a marker in the source buffer, the fringe or a dedicated breakpoint list. The visual indicator matters because it lets you verify that the intended line is instrumented before starting a lengthy test. If no marker appears, check that the buffer is in the expected Magik mode and that Emacs is connected to the active runtime.
Some setups support a conventional debugger interface that resembles other Emacs debugging tools. In that case, commands may include setting, clearing and listing breakpoints, continuing execution and stepping through the current method. Avoid assuming that a key binding from a generic language mode applies to Magik; inspect the local documentation or key map first.
Break At A Method Or Condition
A line breakpoint is straightforward, but a method breakpoint can be more reliable when source layout changes frequently. Stopping whenever a particular method is entered helps when the method is called from several places or when the relevant line is difficult to identify. This approach is also useful for checking whether a suspected method is being called at all.
Conditional stopping is valuable in collection-heavy code. Suppose a method processes thousands of network objects but only one object produces an invalid result. A condition based on an identifier, attribute value or collection position can prevent the debugger from interrupting every normal iteration. The precise expression syntax and support for conditional breakpoints depend on the Magik debugger integration, so test a simple condition in a safe development session first.
Temporary breakpoints can shorten an investigation. Stop at the first point where a value becomes suspicious, inspect the state, then clear the breakpoint once the cause is understood. Leaving broad breakpoints in shared startup code can slow a session and make later debugging harder for colleagues.
Run To The Breakpoint
After setting the breakpoint, reproduce the behaviour through the same path that triggered the problem. This may mean running a command from the Magik prompt, invoking a Smallworld tool, opening a dataset or executing a focused test. Keep the reproduction narrow where possible; a small test case makes the call stack and object state easier to interpret.
When execution stops, Emacs should identify the current source location and provide access to the debugger prompt or inspection commands. Read the call stack before stepping. The stack shows how the program arrived at the paused method and can expose an unexpected caller, a recursive path or a callback that was not part of the original assumption.
A breakpoint can also confirm a negative result. If execution never reaches it, the defect may occur earlier, a different method definition may be loaded, or the tested workflow may use another code path. Treat a missed breakpoint as evidence about program flow rather than immediately moving the marker.
Inspect Objects And Values
At a pause, inspect the receiver of the current method, local variables and important intermediate values. Magik’s object-oriented model makes the receiver particularly significant: its class, state and available methods often explain behaviour that is not obvious from a single variable name. Object inspection can also reveal whether a value is unset, of an unexpected class or a proxy for data held elsewhere.
For collections, inspect the size, current element and relevant keys or attributes. A collection may contain valid objects overall while one member has a missing value or an unexpected type. If the issue involves database or network data, compare the in-memory object with the source record and note whether the transformation happened before or after the breakpoint.
Use Emacs to keep the source, debugger buffer and evaluation area visible without losing the paused location. Evaluate small expressions rather than changing application state casually. Calling a method that writes data, advances an iterator or modifies a transaction can alter the very behaviour being investigated.
In Australian projects, this discipline is useful when debugging large utilities or infrastructure datasets shared between offices in Brisbane, Adelaide and Canberra. A seemingly harmless inspection can become expensive when it triggers a broad query or operates against a remote development database, so prefer narrow checks over exploratory commands with unknown side effects.
Step Through And Refine
Once the initial state is recorded, step over simple operations and step into the method that contains the next uncertainty. Stepping over avoids unnecessary detail in trusted library code, while stepping into a custom method can show where a value changes. Use step-out or continue when the current frame no longer contributes to the investigation.
Watch for changes at branches, loops and exception boundaries. A conditional expression may choose an unexpected branch because a value is false-like, unset or represented by a different object than expected. A loop may process an empty collection successfully and fail only when a later query returns a different result. Breakpoints placed at these transitions make the cause easier to isolate.
After identifying the fault, refine the breakpoint arrangement. Move the marker closer to the state transition, add a condition if repeated calls are noisy, or remove it entirely after the test passes. Keeping a small set of purposeful breakpoints is more effective than leaving markers throughout every method touched during the investigation.
Record the finding in the code review or issue tracker with the method name, triggering data and observed state. Teams working to Australian project schedules often hand debugging work between time zones, so a short record helps a colleague in Perth or Sydney reproduce the same path without reconstructing the entire session.
Handle Common Breakpoint Problems
A breakpoint that appears inactive may be in a method that is not loaded, a buffer with stale source, or a branch that the test never reaches. Reload the definition, verify the active session and create a simpler breakpoint earlier in the call path. If the new marker is hit, step forward until the divergence becomes clear.
If Emacs cannot communicate with the runtime, check the process buffer and connection details before changing source code. A disconnected session, startup error or incorrect port can look like a debugger failure. Restarting the session may be appropriate, but save useful observations first and avoid losing a reproducible test case.
Breakpoints can also stop too often. Narrow the location, use a condition, or temporarily disable markers in frequently called framework methods. In production-like environments, avoid experimenting with write operations or broad pauses. Use a development copy of the dataset and follow the project’s access controls, particularly when the application handles sensitive utility, customer or government information.
A reliable routine is simple: verify the session, choose a meaningful method, set one precise breakpoint, reproduce the behaviour, inspect before modifying state, and refine the marker as evidence accumulates. With that habit, Emacs becomes more than a text editor; it becomes a practical control centre for understanding Magik execution.
Set up a small Magik debugging exercise in a safe development session, place a breakpoint before a known state change and trace the call stack through to the resulting object. Explore the commands and screen-casts available through the Magik Emacs community, then adapt the workflow to your team’s Smallworld version and Australian project environment.
Core Features
Tab Mode & ECB
Quick tab switching and Emacs Code Browsing mode for navigating Magik codebases efficiently.
Magik Smeller
Code analysis tool that helps identify potential issues in Magik source files.
Code Folding
Hide/Show mode for collapsing and expanding Magik code blocks to focus on what matters.
Visual Bookmarks
Quick visual bookmarks for jumping between key locations in your Smallworld session buffers.
Object Inspector
Inspect Magik objects and display them in an Emacs Deep Print buffer for detailed examination.
Magik Debugger
Set breakpoints and monitor slots and variables directly from within Emacs.
Development Tools
Direct links between Emacs and the Smallworld Development Tools application, including Click Monitor.
Screen-casts & Tutorials
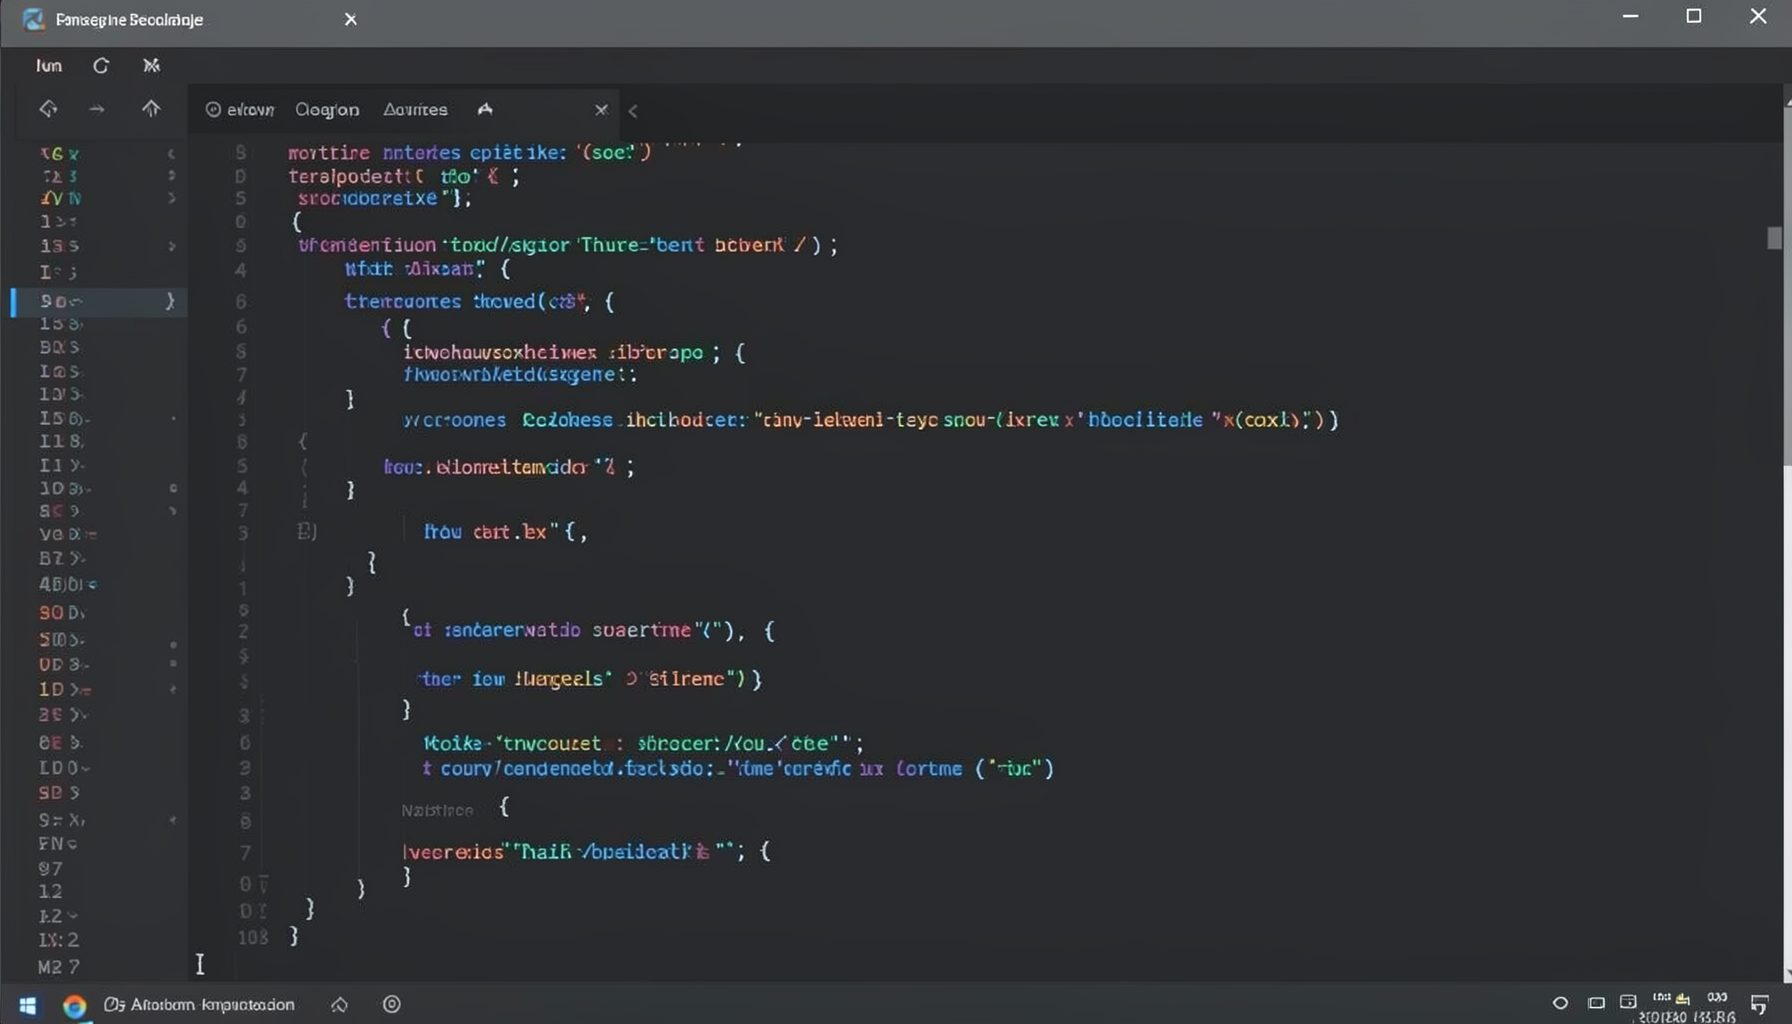
Screen-cast 1: Tab Mode, ECB & More
Covers tab-mode, ECB, Magik Smeller, code folding, visual bookmarks, pragma toggling, moving code, external editor, and MS Explorer.
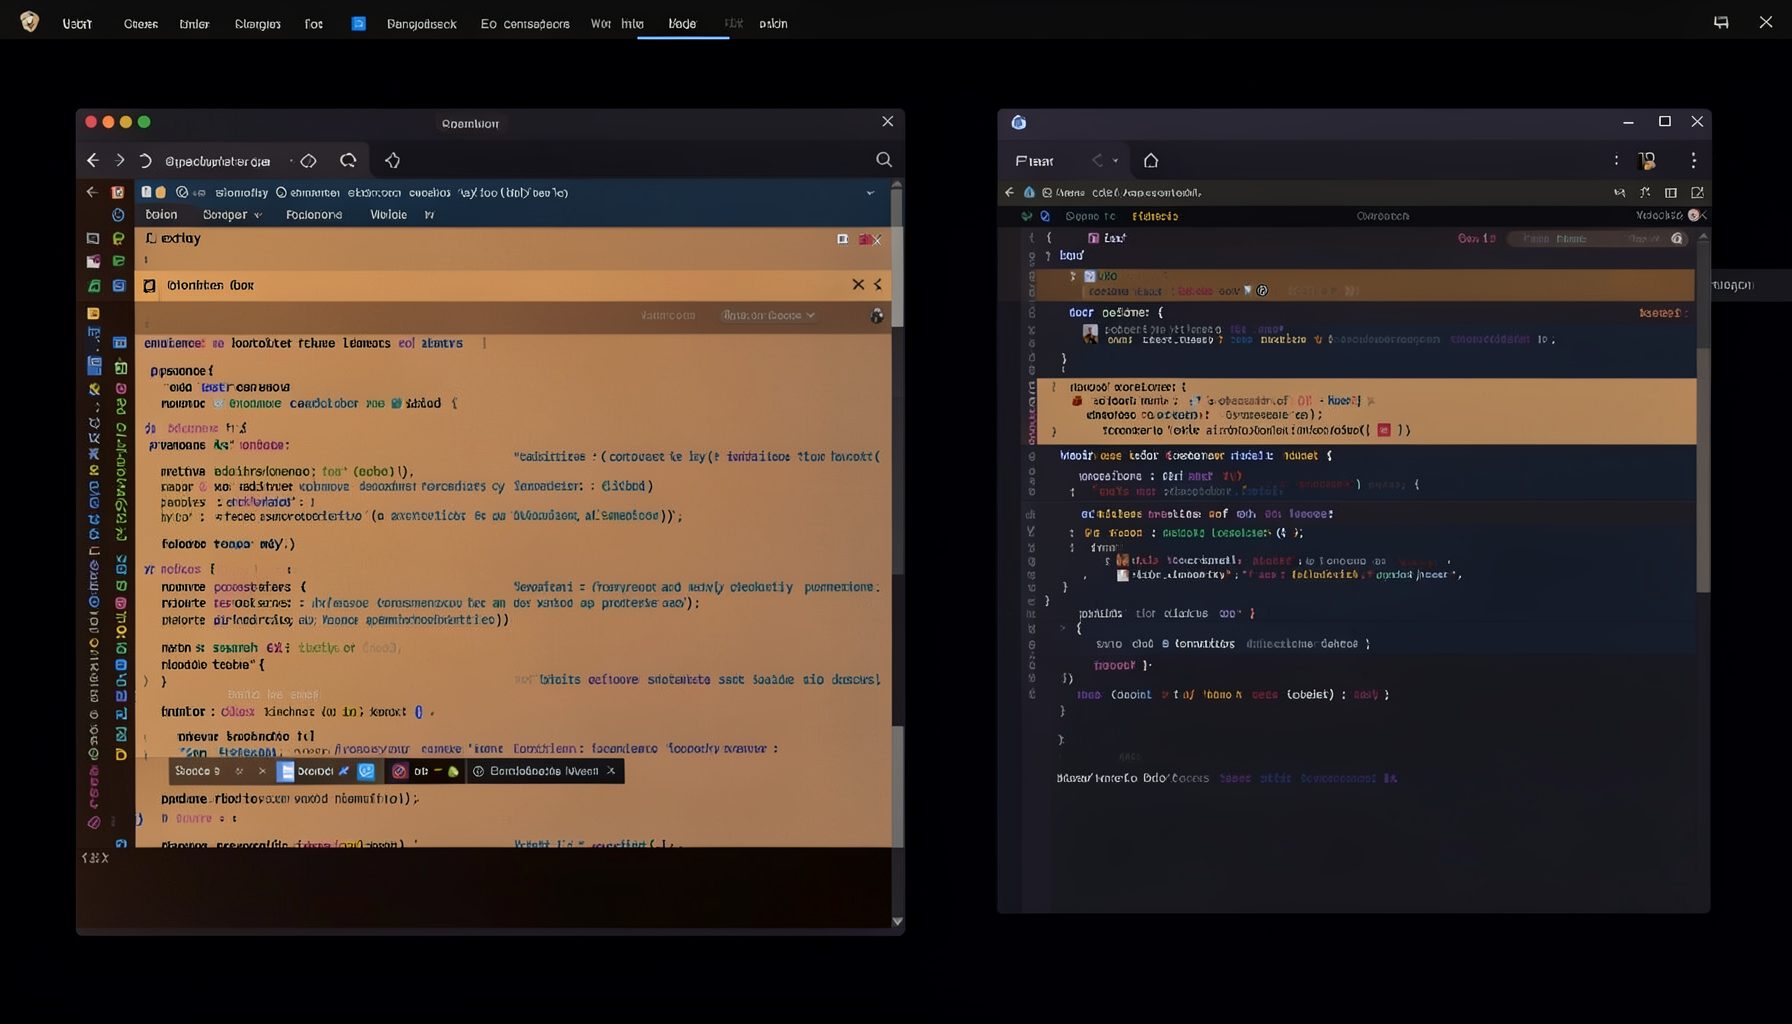
Screen-cast 5: Object Inspection & Deep Print
Inspect a Magik object, prompt for an expression evaluated within a Smallworld session, and display results in a Deep Print buffer.
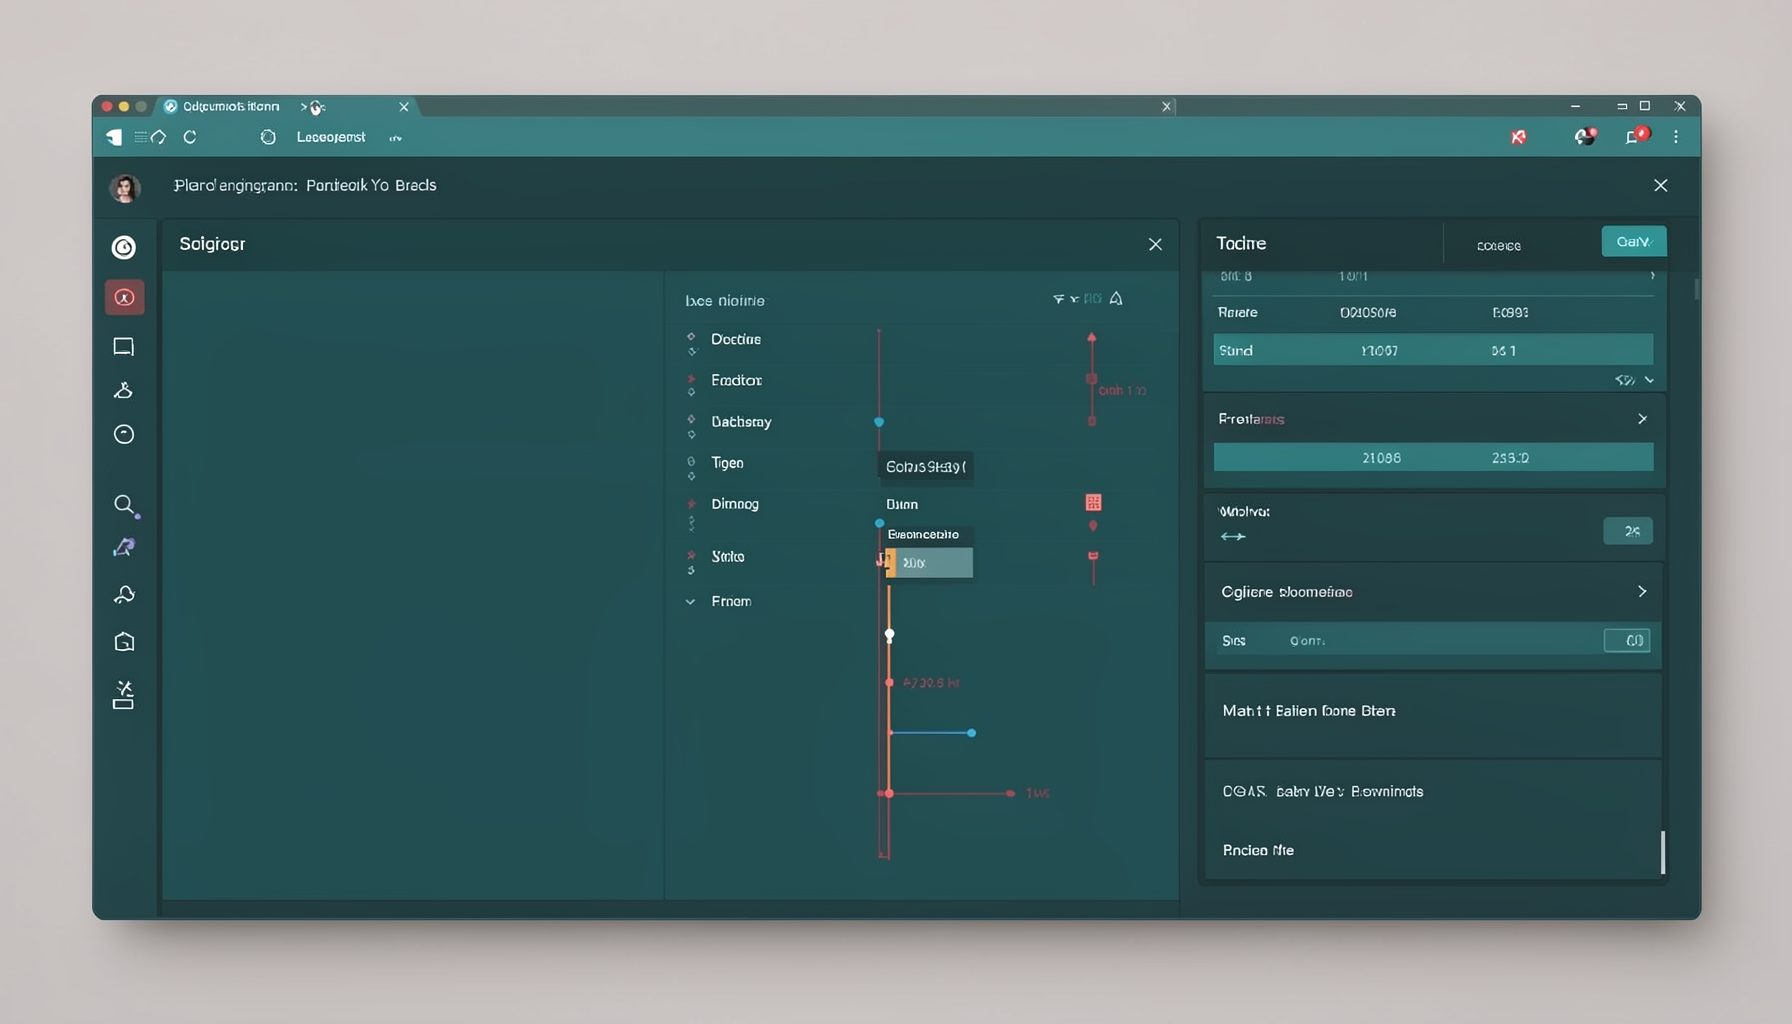
Screen-cast 7: Magik Debugger
Useful tools for application developers: Object Inspector and Magik Debugger with breakpoints and slot/variable monitoring.

Screen-cast 9: Tree Item GUI Control
Tree Item is a GUI control providing extensive facilities for displaying lists with rows, columns, trees, and in-place editing.