Emacs Extensions for
GE Smallworld Magik Development
Screen-casts, tutorials, and productivity tools for Magik programmers who use Emacs. From tab-mode and code folding to the Magik Debugger and object inspector — explore features built by a developer, for developers.
Learn MoreNine screen-casts published between November 2010 and January 2011 — covering everything from ECB mode to the Tree Item GUI control. Read the story behind the project →
Get in Touch
Tuning Magik Performance Through Emacs Profiler Integration
When a Magik session starts to crawl, the temptation is to reach for rewrites, add a few caching layers and hope the slow prompts in the inferior-magik buffer magically speed up. A more reliable path is to measure first, and Emacs already ships with the tools needed to make that measurement frictionless. By wiring the Magik profiler into the same editor you write your code in, you can move from a vague sense that "this method feels slow" to a precise call tree, without leaving the keyboard.
Smallworld installations in Australia are heavily concentrated in the water, gas and electricity sectors, so a sluggish session is rarely just a developer inconvenience. A geographer working on the APA Group network near Adelaide, a planner for Water Corporation in Perth, or an asset recorder updating SWER lines for Essential Energy in regional NSW will each feel unprofiled code ripple into field work and outage planning. The Emacs profiler turns those costs into something you can budget against.
The rest of this walk-through assumes a working magik-mode setup and a recent Smallworld image. You will launch a profiled session, read the tree, jump from hotspots back to source, and bake a lightweight profiling habit into the rhythm of an Australian working day that often starts before 9 am AEST.
Setting Up the Profiler Bridge Between Emacs and Magik
The Magik image exposes its sampling profiler through a small set of methods on the _self object, and the cleanest way to drive them is from a source buffer rather than a hand-typed REPL prompt. The magik-profiler package that ships with the Magik Emacs extensions defines a transient prefix bound to a single key, which calls profiler_start() on the connected image and echoes the resulting handle into the minibuffer. Once running, the profiler samples the call stack on a configurable interval, normally five or ten milliseconds, which is short enough to catch short-lived methods without flooding the inferior process.
Because sampling is opt-in, the bridge is usually wrapped so the same key starts and stops a session, then dumps a snapshot. A practical pattern is to keep a dedicated *Magik Profile* buffer alongside *inferior-magik*. When the bridge starts, the buffer is created; when it stops, the snapshot is parsed into a tree and rendered in place. Developers across the Brisbane office of Urban Utilities and a remote field laptop in Mount Isa keep a per-host customisation so the snapshot path is project-relative, which makes it easy to compare runs from different machines without hunting through ~ paths.
A second, often overlooked step is to ensure the magik-debugger integration is enabled before the first sample. The profiler relies on the same method-resolution machinery the debugger hooks into, and a disabled debugger leaves resolved frames without their source location. Once both are loaded, the bridge is essentially invisible: one keystroke to begin, one to finish, and the workspace already has something to look at.
Capturing Samples Without Distorting the Numbers
A sampling profiler works by interrupting the running image at fixed intervals and asking what it is doing at that moment. The faster your code runs, the more samples it accumulates, and the more confidence you have in the resulting percentages. The catch is that some Magik patterns change their behaviour when interrupted, especially those that depend on tight loops over rope! or record_traversal(). To keep the data honest, run the profiler over a workload that resembles production, not over a single hand-typed method call.
A useful rule of thumb is to drive the profile from a repeatable scenario. In a Magik session connected to a Sydney Water training database, you might script a "load all valves in a suburb" routine and wrap it in a profiler_start() / profiler_stop() pair. The scenario is identical on every run, which makes the percentages comparable. A simple profiler-run-scenario command invokes the script through the inferior process, waits for the prompt to return, and only then asks the image for the snapshot, avoiding the classic mistake of stopping the profiler before the workload has actually finished.
Sample interval deserves attention as well. A five-millisecond interval is fine for CPU-bound code that runs for tens of seconds, but when profiling a quick import job over a sleepy regional link into the AEMO market systems, a coarser interval is often better so the profiler overhead itself does not show up as a hotspot. The magik-profiler prefix exposes this as a numeric argument, and a comfortable starting point is to halve the interval until the top of the tree stops changing between runs.
Reading the Call Tree and Jumping Back to Source
The snapshot buffer is essentially a flattened call tree with self-time, total time and sample counts. The first scan should always be for fat rows at the bottom of the tree, because those are the leaf methods where time is actually being spent. A method that appears high in the tree but has small self-time is usually a victim of its callees, not the cause of the slowness. In a typical Smallworld session, the leaves that consistently rise to the top are things like rope.size(), simple_vector.append() and a handful of geometry predicates hammered by every map redraw.
Emacs makes navigation effortless. Each row in the tree buffer is bound to a jump that opens the corresponding Magik file and moves point to the offending method definition, provided the source is on your magik-source-paths. The default binding mirrors the debugger's d, so the muscle memory transfers. From a small office in Melbourne where a four-person team is reviewing an overnight batch run for South East Water, this jump-to-source behaviour turns the profile from a curiosity into an actual code review artefact. A junior developer can read the tree, follow the arrows and arrive at a method without ever asking a senior where the file lives.
Filtering matters once the tree grows beyond a few hundred frames. The magik-profiler buffer supports a g repaint that re-reads the snapshot with a threshold, hiding methods that account for less than, say, one per cent of total time. That single feature is often the difference between a profile you read in five minutes and one you abandon after thirty seconds. To share the filtered view, a w command writes a copy of the current tree to a plain-text file, which is convenient for dropping into a Confluence page or a Jira ticket raised against the Smallworld support desk, provided the snapshot has been scrubbed of any personal information in line with the Privacy Act 1988.
Acting on Profile Data for Real Gains
A profile is only useful if it changes the code, and a small set of Magik patterns account for most of the wins. The first is unnecessary repeated rope! lookups inside a loop. The profile almost always shows a leaf like rope.get() taking a non-trivial percentage of self-time; the fix is to resolve the slot once outside the loop and reuse the value. The second is the classic "iterate the whole collection to count" pattern, which is easy to write in Magik and very easy to overlook. A profile of a weekly meter-reading job for a Queensland distributor often reveals that ds_collection.size() is being called in a tight inner loop when the count is already available from the cursor.
Database access is the third area where profiles pay off quickly. A slow method that spends most of its time in _self.gis_program_manager.dm_process() usually has a fix on the database side rather than the Magik side: a missing index on a SWER feeder table, a stale statistics snapshot, or a query that pulls geometry when it only needs attribute data. The Emacs profiler will not tell you to add an index, but it will tell you that the time is not in your code, which is just as valuable. Once you know that, you can hand the profile to the DBA in your Perth or Sydney office with a clear story about which Magik call is dragging.
A last habit is to re-run the profile after every change. Magik's interactive image makes this cheap: edit the method, press C-c C-c to evaluate, replay the scenario, and compare the new tree against the old one. The tree buffer can keep the previous run as a reference, so the deltas appear line by line. This tight loop is what turns tuning from a once-a-year exercise into something that fits inside a normal morning in front of the terminal.
Embedding Profiling into Daily Development Habits
The fastest way to make profiling a habit is to remove the cost of starting it. A sensible customisation is to bind f5 globally inside magik-mode to the start/stop bridge, and f6 to "run last scenario and profile". After a week of use the keys become automatic, and a developer reaches for them the moment a session feels sluggish instead of guessing. Teams that have adopted this pattern, including a small group supporting SA Water's spatial data warehouse, report that the median time to identify a hot method drops from a day of code reading to a single morning.
It also helps to keep snapshots per project, with a naming convention that includes the date, the build number of the Smallworld image and a short tag describing the scenario. A path such as ~/projects/sydney-water/profiles/2024-05-12-r12345-valves.txt is self-explanatory six months later, even after the team that produced it has moved on. The magik-profiler package writes to a project-relative path through a directory variable, so each repository ships with its own convention and onboarding documentation can simply point at the buffer.
Sharing the discipline matters as much as sharing the data. A weekly profile-of-the-week note, circulated across the Sydney, Melbourne and Perth offices of a utility consulting team, surfaces recurring hotspots and celebrates wins with little effort. Over a quarter, the cumulative effect is a noticeably snappier Magik image, a more confident set of developers, and a defensible answer when an asset owner asks why the latest release feels faster. The Emacs profiler integration is not glamorous, but it is the lever that makes the rest of it possible.
The next step is yours: subscribe to the Magik Emacs update feed for new releases of the profiler package, share your tuning stories in the community channel, or reach out to HydePark Consulting for hands-on help embedding profiling into your Smallworld workflow.
Core Features
Tab Mode & ECB
Quick tab switching and Emacs Code Browsing mode for navigating Magik codebases efficiently.
Magik Smeller
Code analysis tool that helps identify potential issues in Magik source files.
Code Folding
Hide/Show mode for collapsing and expanding Magik code blocks to focus on what matters.
Visual Bookmarks
Quick visual bookmarks for jumping between key locations in your Smallworld session buffers.
Object Inspector
Inspect Magik objects and display them in an Emacs Deep Print buffer for detailed examination.
Magik Debugger
Set breakpoints and monitor slots and variables directly from within Emacs.
Development Tools
Direct links between Emacs and the Smallworld Development Tools application, including Click Monitor.
Screen-casts & Tutorials
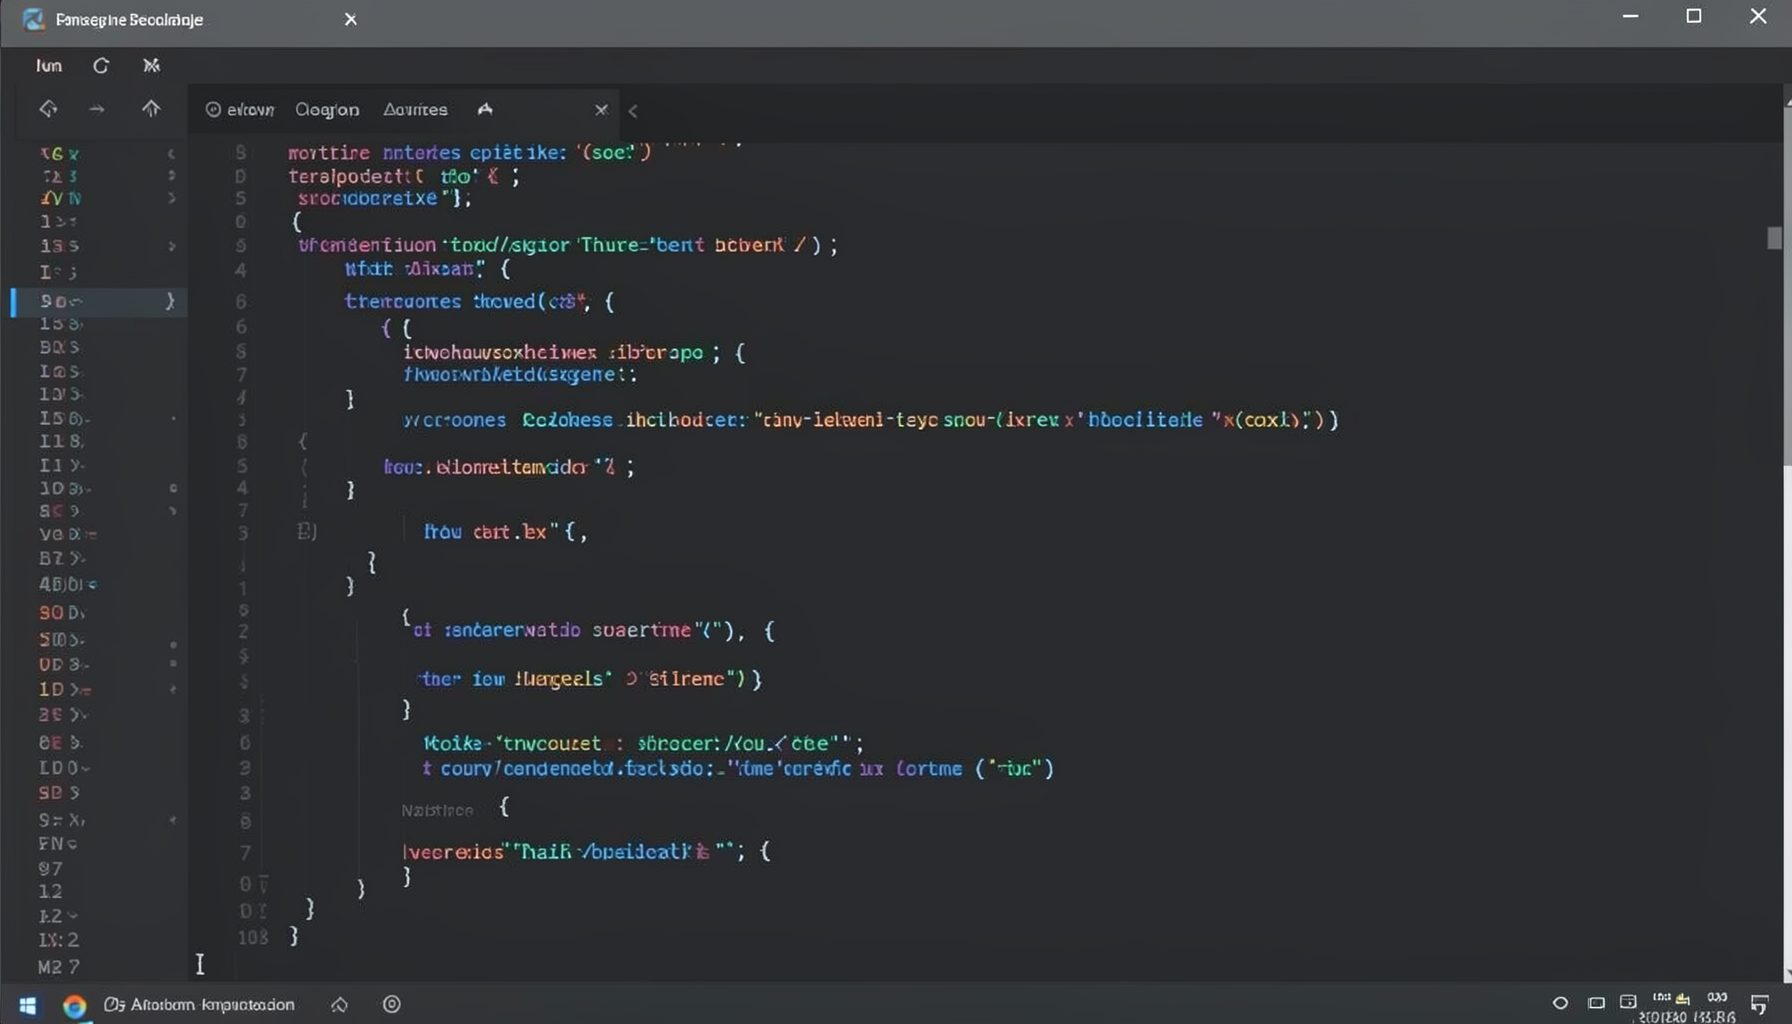
Screen-cast 1: Tab Mode, ECB & More
Covers tab-mode, ECB, Magik Smeller, code folding, visual bookmarks, pragma toggling, moving code, external editor, and MS Explorer.
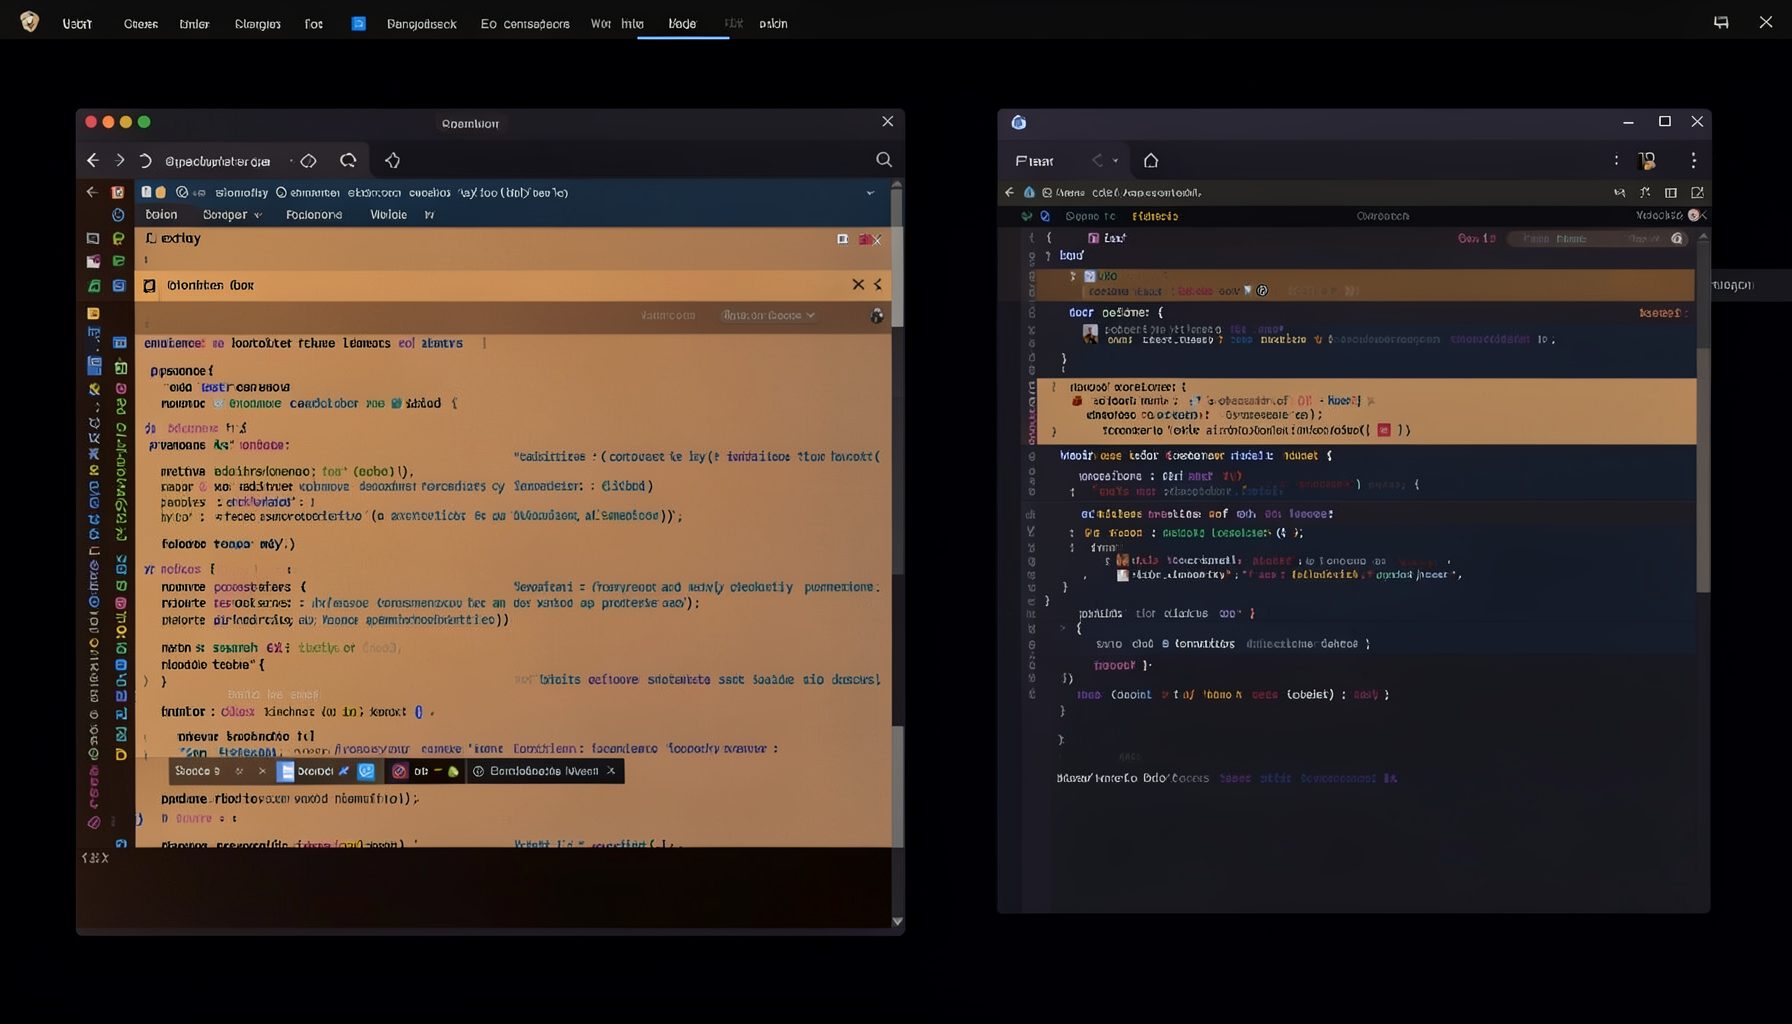
Screen-cast 5: Object Inspection & Deep Print
Inspect a Magik object, prompt for an expression evaluated within a Smallworld session, and display results in a Deep Print buffer.
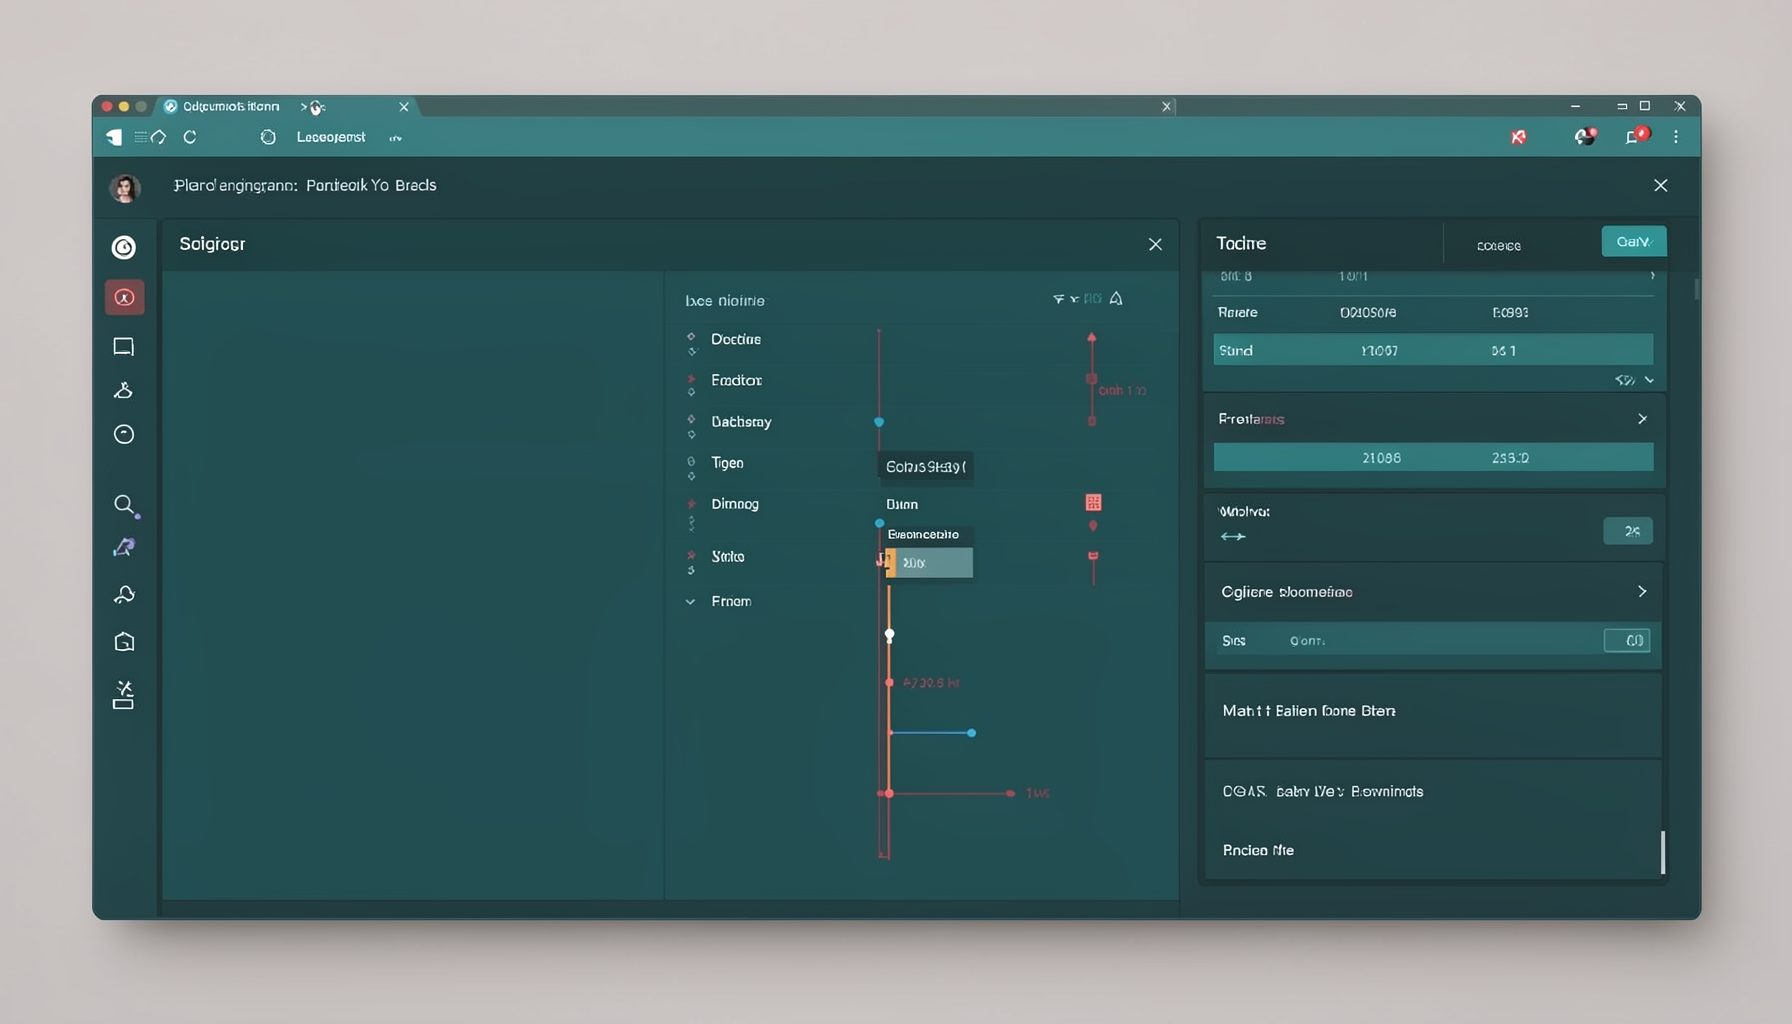
Screen-cast 7: Magik Debugger
Useful tools for application developers: Object Inspector and Magik Debugger with breakpoints and slot/variable monitoring.

Screen-cast 9: Tree Item GUI Control
Tree Item is a GUI control providing extensive facilities for displaying lists with rows, columns, trees, and in-place editing.