Emacs Extensions for
GE Smallworld Magik Development
Screen-casts, tutorials, and productivity tools for Magik programmers who use Emacs. From tab-mode and code folding to the Magik Debugger and object inspector — explore features built by a developer, for developers.
Learn MoreNine screen-casts published between November 2010 and January 2011 — covering everything from ECB mode to the Tree Item GUI control. Read the story behind the project →
Get in Touch
Magik backtraces in Emacs: a practical workflow
Magik errors often arrive as a stack of method calls rather than a tidy exception message. When a Smallworld application fails, the useful evidence is the call path: which method was active, which source file supplied it and where control changed. Emacs backtrace mode gives that evidence a keyboard-friendly workspace, with clear limits that Magik programmers should understand before adopting it.
Magik runs within GE Smallworld’s application stack, while Emacs is a separate client. A backtrace displayed by the Magik Development Environment is not automatically an Emacs buffer, and Emacs cannot pause a remote Smallworld server merely because backtrace mode is enabled. Treat the mode as a native reader for Emacs Lisp errors and as a way to inspect a prepared copy of a Magik stack trace.
Developers in Sydney and Melbourne often move between Windows development servers, remote hosts and local editing tools, so trace collection and source paths matter as much as frame navigation. The workflow below separates those responsibilities, shows where the mode fits and explains how to avoid mistaking convenient navigation for live debugging.
What the mode actually provides
Emacs backtrace mode is a dedicated mode for following frames in an error backtrace. It highlights frame information and provides commands such as backtrace-next and backtrace-previous, letting you walk through the call sequence without repeatedly scrolling. When a frame includes usable source information, file and line navigation become easier. This helps when early frames describe framework plumbing and the important failure lies deeper in the stack.
The distinction between a trace and a debugger matters. A trace records calls made up to a failure; a debugger pauses a program, exposes state and allows execution to resume or change. Backtrace mode reads the record. It does not attach to Magik, set breakpoints, evaluate a Magik object or modify a transaction. Live investigation still belongs in the Magik Development Environment or another supported Smallworld debugging facility.
Native Emacs errors are the easiest case. With debug-on-error enabled, a fault in an Emacs Lisp extension can open a *Backtrace* buffer that Emacs presents in backtrace mode. Use this path to test the extension itself, such as a code-folding command receiving a malformed buffer or a navigation function receiving the wrong data shape. Magik trace inspection applies the same reading habits to server-side evidence.
Preparing a Magik stack trace
A Magik stack trace usually contains more context than the final error text, but its layout depends on the Smallworld release, the view that produced it and the information enabled in the environment. Copy the complete trace, including the exception message and every visible frame. Do not trim it to the familiar method: earlier frames frequently reveal the object, collection or transaction that made the later call unsafe.
Preserve method names and source locations verbatim. A trace may identify a method by name, a file and a line; it may also show a qualified routine name or an internal runtime frame. Store the capture as plain text beside the relevant project documentation, with the date, Smallworld release and test scenario in a short header. That record helps when a defect is intermittent or tied to a particular dataset.
Check source paths from the perspective of the Emacs process, not the machine that copied the trace. A Windows path from a development workstation may not exist on the machine running Emacs, and a database-backed source location may not resolve at all. Keep the original unchanged, then create a viewing copy if paths need shortening. Mark unavailable locations instead of rewriting the evidence.
Enabling and navigating backtrace mode
To try the mode without changing project code, open the saved trace as text and run M-x backtrace-mode. An Emacs-generated backtrace normally arrives in a buffer already configured for the mode. Move with M-x backtrace-next and M-x backtrace-previous, which provide frame-by-frame navigation without relying on another major mode’s key bindings.
Native Emacs debugging can be enabled temporarily with (setq debug-on-error t) and disabled with (setq debug-on-error nil). Keep this setting in a development session or controlled Emacs configuration rather than a production service. It changes what Emacs does after a Lisp error, so it can interrupt workflows that would otherwise continue. It has no effect on errors raised inside the Smallworld application.
For a Magik trace, use a readable frame layout resembling the backtrace convention understood by the mode. An illustrative conversion is:
backtrace()
  customer_lookup (/home/developer/project/customer.magik:128)
  order_service (/home/developer/project/orders.magik:47)
This is a viewing convention, not a replacement for the original diagnostic output. Method names remain visible, but paths must exist on the computer running Emacs if file opening is to work. Test each location and distinguish a method boundary from a source line that merely contains a call.
Compare the debugging paths
Not every failure needs the same tooling. Choose the evidence you need before deciding which view belongs in front of you.
| Situation | Best starting point | What to inspect | Main limitation |
|---|---|---|---|
| Emacs Lisp extension fault | Emacs *Backtrace* buffer |
Lisp call sequence and available source references | No Smallworld runtime state |
| Magik method fault | Captured Magik stack trace | Method sequence and readable file or line details | No live values or execution stepping |
| Reproducible Magik failure | Supported Smallworld debugger | Current execution context and values | Requires the right environment and access |
Backtrace mode occupies the middle path: it makes recorded evidence easier to read, but it cannot replace the runtime view. Choose a live debugger when the answer depends on a variable’s value at the moment of failure. Choose the trace reader when you need to compare call paths across runs or incidents.
Keep the original Magik output and your notes beside the viewing copy. A hand-prepared frame can lose a qualifier or exception subtype, so backtrace mode should organise evidence rather than become its only surviving copy.
Connecting frames to Magik sources
Source navigation works only when a location can be interpreted and opened. With a conventional frame such as method_name (/absolute/path/file.magik:128), the mode can associate that frame with a file and line. The exact file-opening command belongs to the mode’s frame commands, so check the Emacs documentation for your installed release instead of assuming a key from another major mode.
If a frame contains only a method name, navigation can still move between frames, but it cannot invent a file. Pair those frames with a local symbol search. Search the Magik workspace for the method definition and record the relevant file and line separately; a qualified name may have several definitions, so include the owning object or class in the search.
When traces come from a remote server, consider the source-control revision as well as the path. A working copy may have moved since the incident, and a local method may not match the deployed one. Record a revision identifier in the trace header and use files from that revision when practical. Otherwise, treat line jumps as approximate pointers and use the trace to identify the method, not to certify the exact deployed statement.
Reliable traces in daily development
Smallworld debugging often happens under operational constraints. Transactions can be expensive to replay, and a trace may describe behaviour that depends on live collection data. Australian teams commonly budget development environments in Australian dollars while source paths and server identifiers follow the conventions of their host operating systems. Record enough detail to repeat the scenario without assuming a shared local setup.
Timing shapes local practice too. The AFL Grand Final can divert engineering attention in Melbourne, and the Melbourne Cup on the first Tuesday of November can interrupt release windows. A trace copied during those periods should include a timestamp with an Australian Eastern Standard Time offset where appropriate. Standardising that timestamp makes comparison with server logs easier when clocks use different time zones.
Long sessions benefit from deliberate breaks. If downtime includes reviewing an online casino comparison, check the Australian regulatory position first: ACMA blocks many offshore online casino sites, while legitimate betting services must appear on the authorised-operator list for the state or territory where you live. Keep that decision separate from debugging data, and never paste account or payment details into a trace file or Emacs Lisp buffer.
Finally, separate local convenience from portable evidence. A trace containing customer identifiers or proprietary geometry should be handled under the same access controls as the underlying Smallworld data. Redact sensitive values in a derived copy, preserve access to the restricted original, and avoid sending complete traces into public issue trackers.
Build a repeatable Magik debugging habit
Start with one repeatable failure rather than a whole application. Capture a Magik stack trace from a disposable test scenario, save it with its runtime and revision details, and open the viewing copy with M-x backtrace-mode. Walk through every frame and write one sentence explaining the transition that led to the error. That exercise shows whether the trace contains enough information to guide the next investigation.
Then make the workflow visible to your team. Add a short trace-capture checklist beside your Magik development notes, agree on filename conventions, and keep debug-on-error confined to development Emacs sessions. Use Magik Emacs tutorials and screen casts to share working examples, and explore HydePark Consulting’s support when a workflow needs deeper Smallworld or Emacs expertise.
Reproduce one controlled failure today, preserve the evidence, and turn it into a documented trace that another Magik programmer can follow without a verbal reconstruction.
Core Features
Tab Mode & ECB
Quick tab switching and Emacs Code Browsing mode for navigating Magik codebases efficiently.
Magik Smeller
Code analysis tool that helps identify potential issues in Magik source files.
Code Folding
Hide/Show mode for collapsing and expanding Magik code blocks to focus on what matters.
Visual Bookmarks
Quick visual bookmarks for jumping between key locations in your Smallworld session buffers.
Object Inspector
Inspect Magik objects and display them in an Emacs Deep Print buffer for detailed examination.
Magik Debugger
Set breakpoints and monitor slots and variables directly from within Emacs.
Development Tools
Direct links between Emacs and the Smallworld Development Tools application, including Click Monitor.
Screen-casts & Tutorials
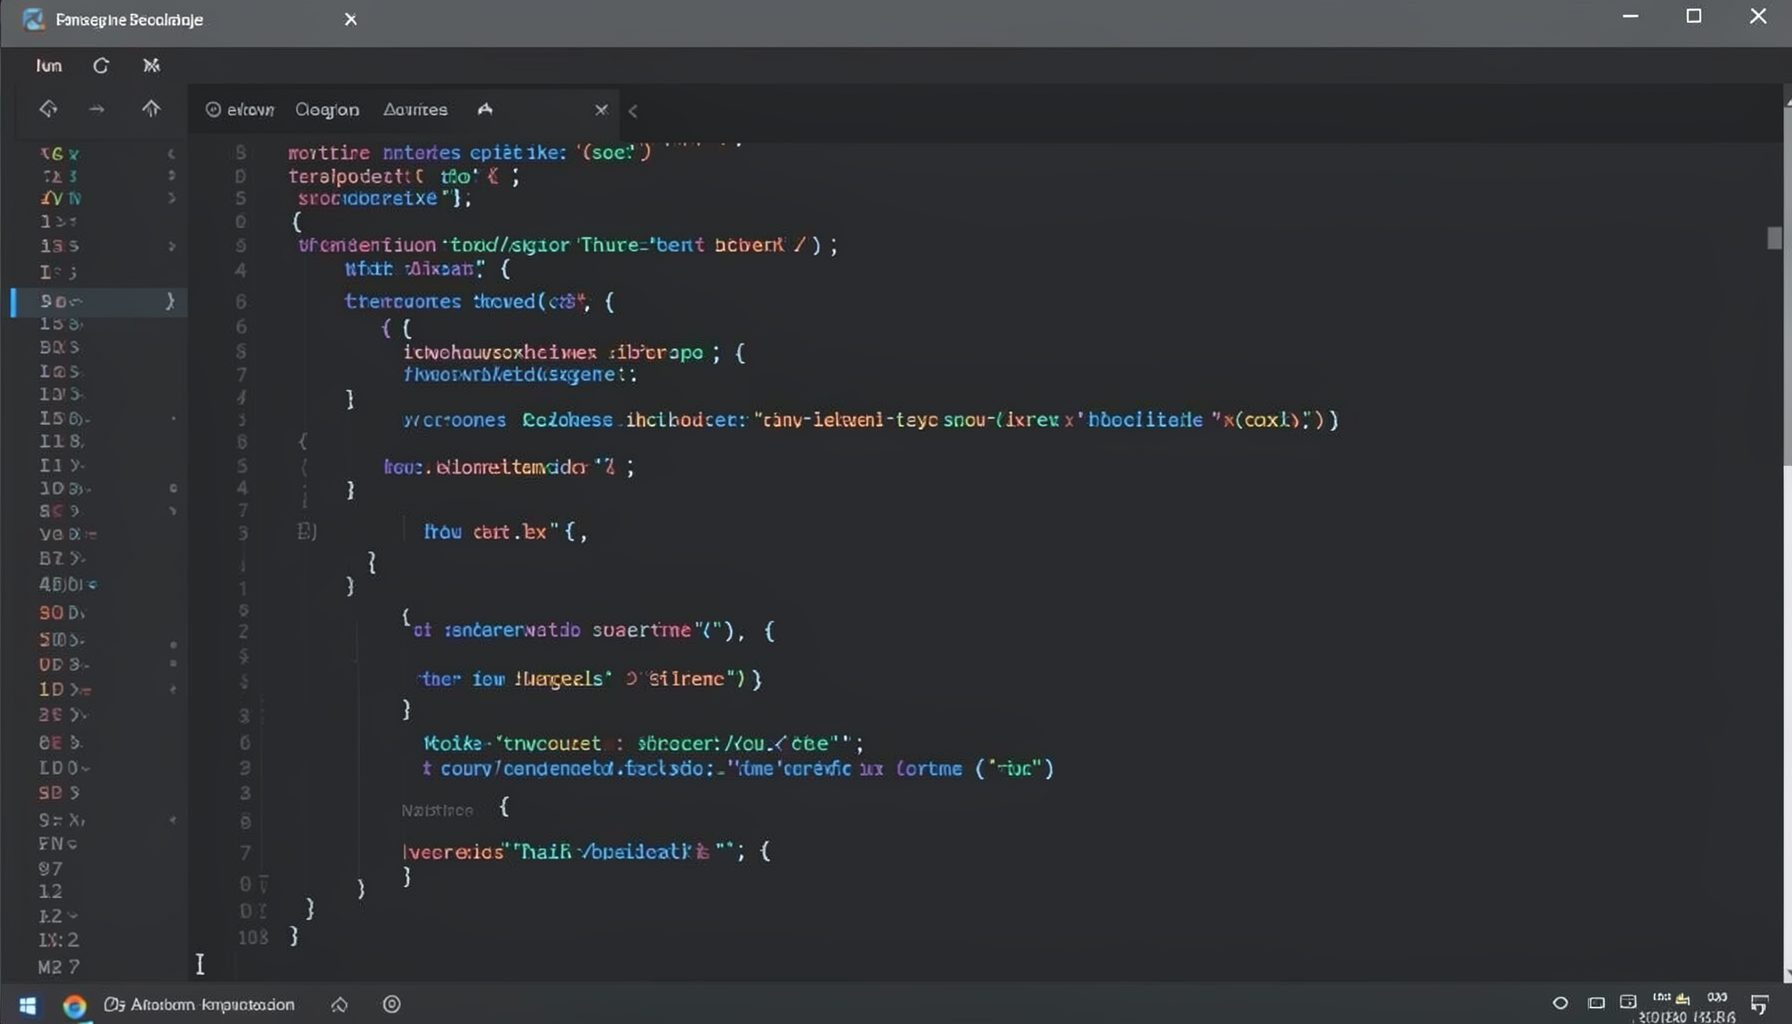
Screen-cast 1: Tab Mode, ECB & More
Covers tab-mode, ECB, Magik Smeller, code folding, visual bookmarks, pragma toggling, moving code, external editor, and MS Explorer.
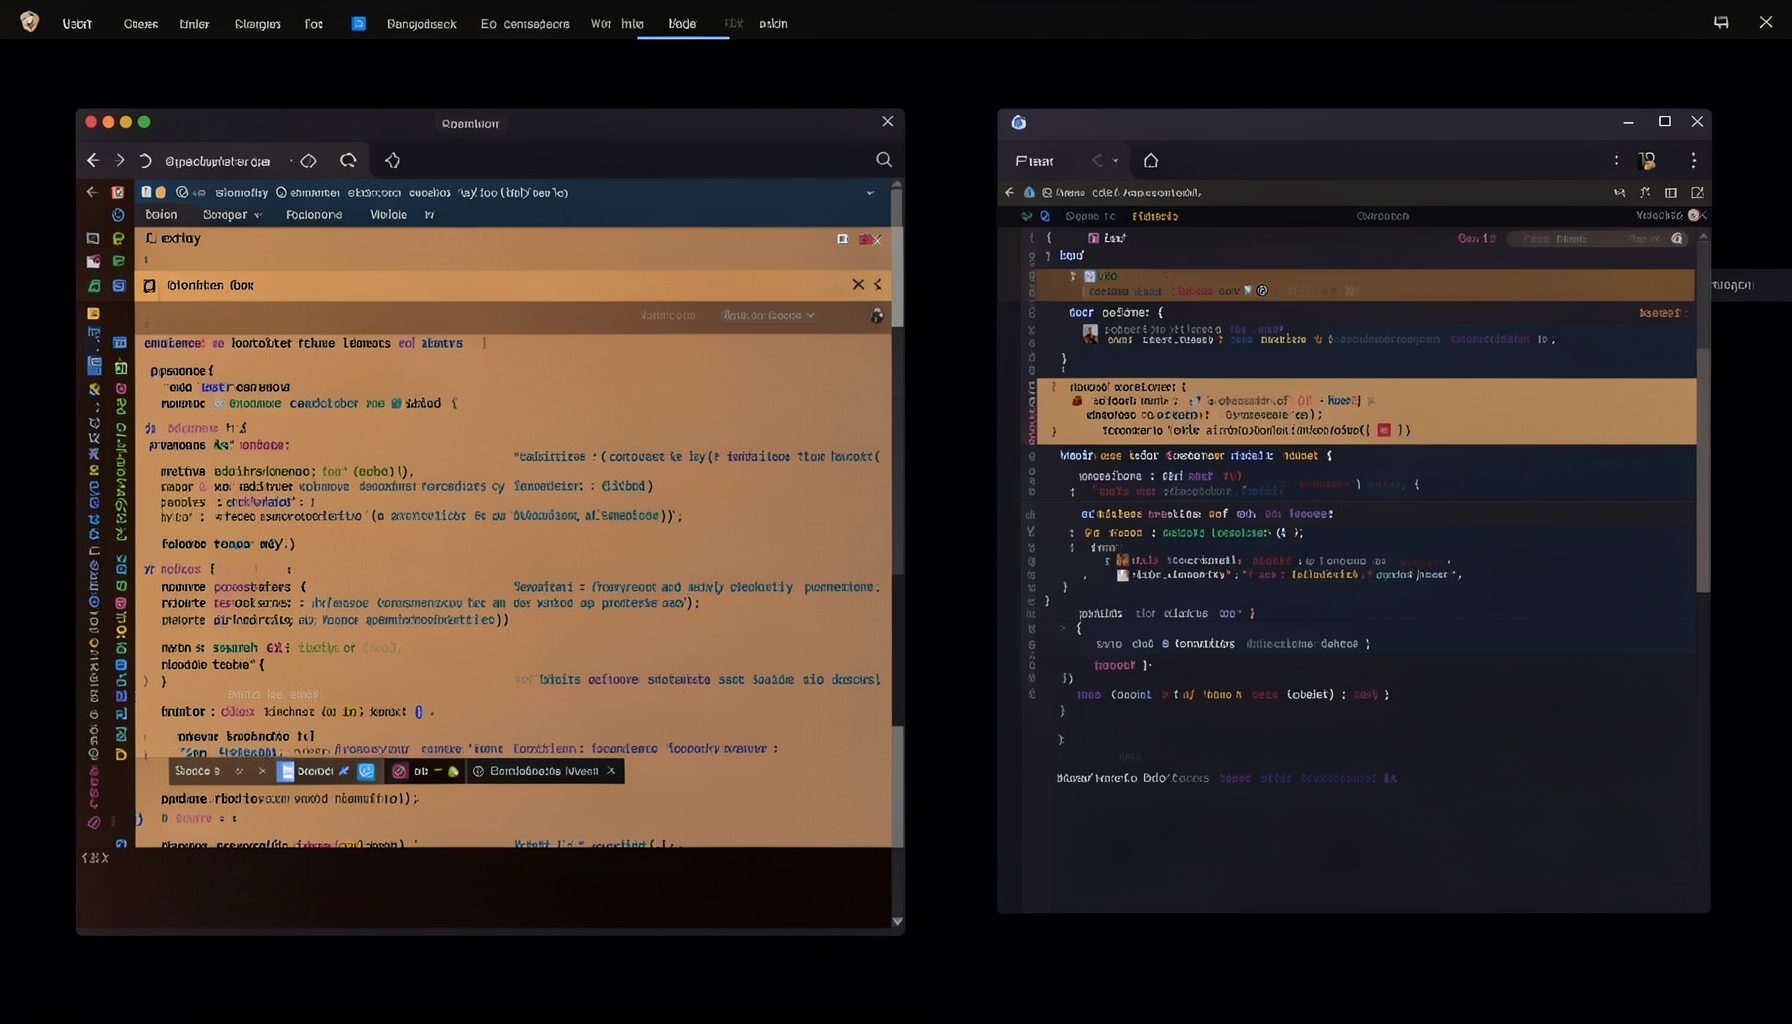
Screen-cast 5: Object Inspection & Deep Print
Inspect a Magik object, prompt for an expression evaluated within a Smallworld session, and display results in a Deep Print buffer.
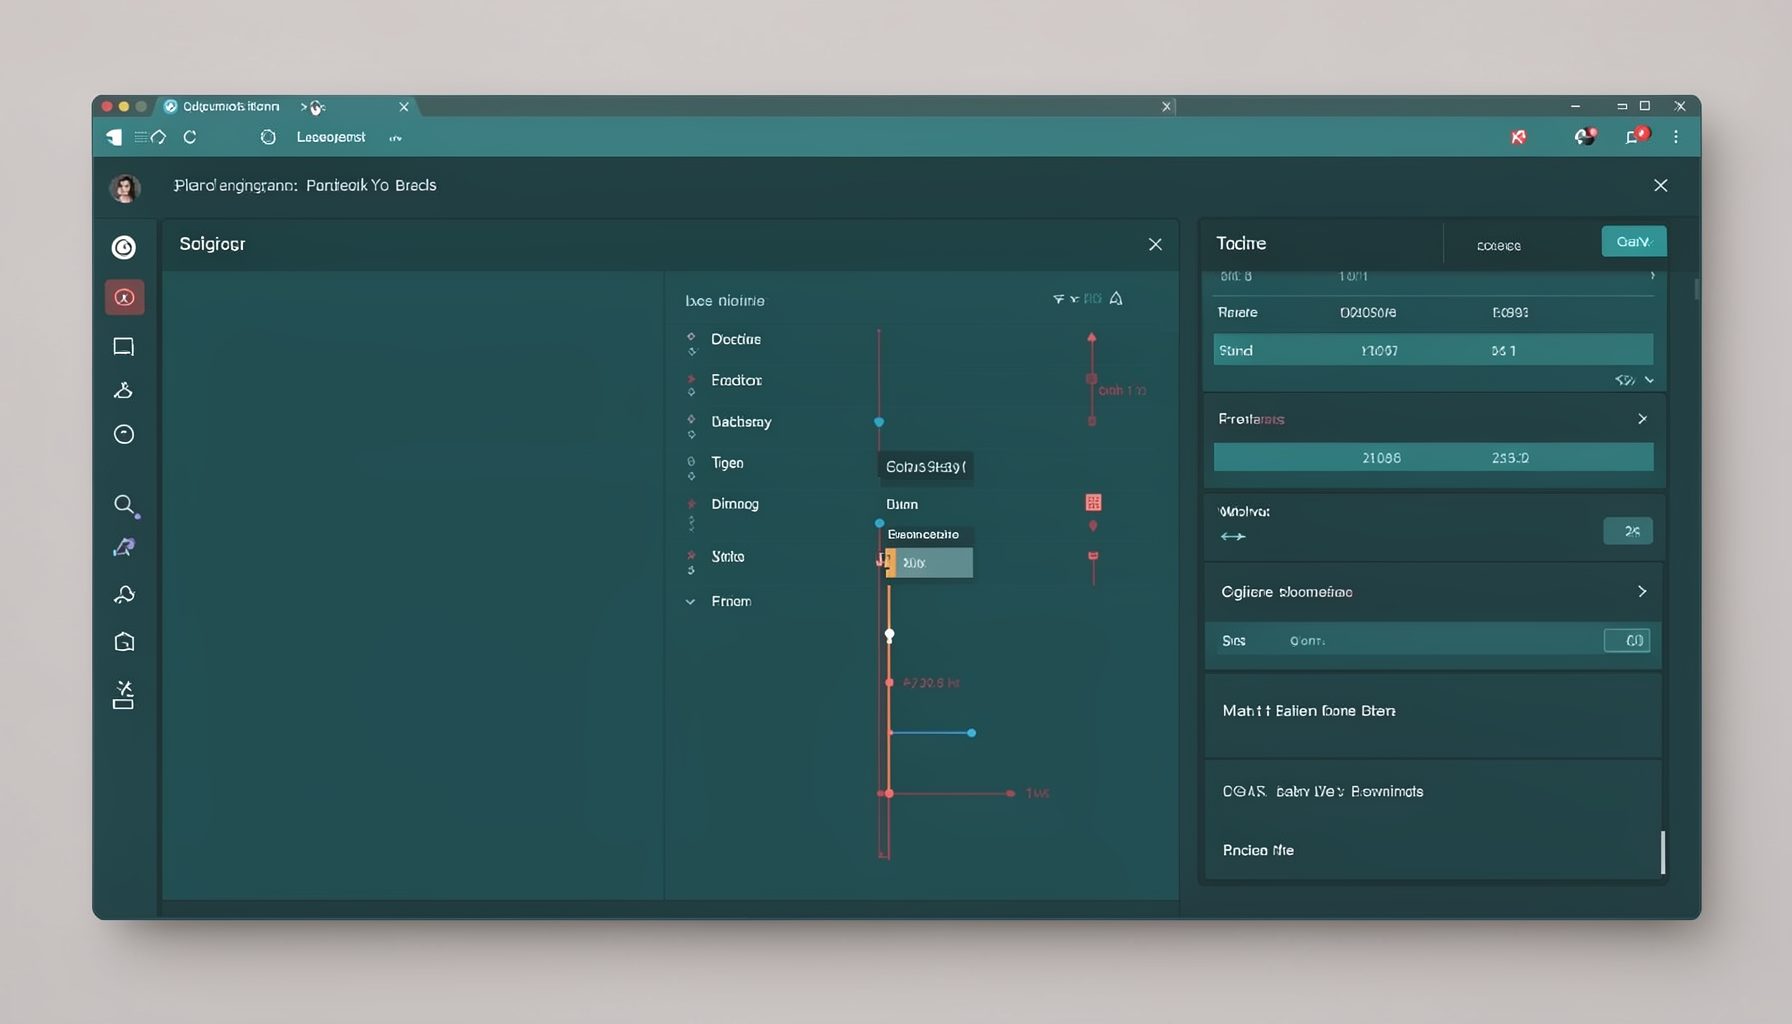
Screen-cast 7: Magik Debugger
Useful tools for application developers: Object Inspector and Magik Debugger with breakpoints and slot/variable monitoring.

Screen-cast 9: Tree Item GUI Control
Tree Item is a GUI control providing extensive facilities for displaying lists with rows, columns, trees, and in-place editing.