Emacs Extensions for
GE Smallworld Magik Development
Screen-casts, tutorials, and productivity tools for Magik programmers who use Emacs. From tab-mode and code folding to the Magik Debugger and object inspector — explore features built by a developer, for developers.
Learn MoreNine screen-casts published between November 2010 and January 2011 — covering everything from ECB mode to the Tree Item GUI control. Read the story behind the project →
Get in Touch
Visualising Magik Local Variables in Emacs
Magik code often places important intermediate results in local variables, then passes those results through several collection and object operations. The source can look straightforward while a runtime investigation asks harder questions: Which binding is active? Has the value changed? Is this object the same one referenced by the caller? A useful visualisation must connect the variable name in the method with its binding, value, and scope.
Emacs is well suited to this because its editor, navigation, and debugging layers can share information about the same source buffer. A Magik-aware extension can highlight declarations, mark reads and writes, show a scope summary, and connect static analysis with values supplied by a debugger. The result is more than coloured syntax: it becomes a map of how data moves through the method, including calls into Smallworld collections and transactional objects.
Where Local Values Become Hard to Track
Local variables are easy to overlook when they sit between a domain object and a transformation. A name such as candidate_records may first hold a collection, then a vector produced by fast_elements(), and finally a filtered subset. If those stages occupy separate expressions, a reader has to infer the changes without seeing their types or identities.
Source inspection also creates false matches. A search for candidate_records may also match a property, an argument, or a local in another method. A source-level report may describe a declaration rule, while the debugger shows the actual binding in the selected call frame. These views need to agree before they can guide a reliable fix.
For a distributed Australian team, ambiguity multiplies when a trace moves between Sydney and Melbourne and support arrives from Perth or Brisbane. Clock differences and the AEST/AEDT daylight-saving calendar can add noise to timestamps, while the logical scope of a local remains unchanged. Showing the source declaration beside the selected runtime frame gives reviewers a stable reference during that handover.
Magik Scope, Bindings, and Lifetimes
A binding links a name to a value during a particular routine activation. In a Magik method, formal arguments and _local declarations provide the usual local names, while object properties belong to the receiver rather than the method’s stack frame. The local’s source visibility normally ends when that activation ends; a returned object may continue to exist, but the local name does not follow it.
Consider simplified Magik such as _method reconcile_region(region), followed by _local candidate_records, an assignment from region.records, and a later return of candidate_records.size. The argument region is a formal parameter; candidate_records is a declared local; region.records is a property reached through another binding. Each name has a different route into the computation, even when they appear on one line.
Special runtime names such as _self, _proc, and _thisthread should be treated as ambient context rather than ordinary locals. Debugging a callback or nested procedure can add more frames without making every nearby name global. For each local, record where it is declared, where it is written, where it is read, and what type or identity it holds at each important write.
An Emacs Workspace for Variable Discovery
Static visualisation starts with a Magik parser that recognises declarations, formal parameters, assignments, and references. An Emacs extension can turn that information into font-lock faces, so declarations, reads, and writes remain distinguishable without replacing the file’s text. Scope overlays can mark the active routine, while an Imenu index can place its parameters and locals directly in the buffer outline.
The same scope map can support navigation. Jumping from an occurrence to its declaration, listing references with occur, folding a long routine with code folding, and following method calls all reduce the need to hold a large procedure in working memory. show-paren and incremental search remain useful for checking the expression that produced the current value, particularly around collection filters and chained property access.
Live values require a separate bridge. An extension needs a debugger or evaluation service that can select a frame, resolve a Magik binding in that frame, and return its value without altering program state. Emacs can then place that result beside the source, but stock Emacs syntax colouring cannot supply runtime data by itself. Keeping the static map and runtime adapter separate makes the display useful even when a connection is unavailable.
Inspecting Values, Frames, and Side Effects
Every active routine can contribute a stack frame containing its parameters and locals. A useful frame view shows the selected method, caller, and current value of each binding, with uninitialised or unavailable entries marked explicitly. This prevents a value from one activation being mistaken for the same name in a recursive or repeated call.
Values also need compact representations. A Smallworld collection may be shown as its class, element count, and a short preview rather than a full dump. The object inspector can then expand selected elements, reveal properties, and compare identity without flooding the buffer. For vectors produced by fast_elements(), checking count and a few representative entries often reveals an empty filter or an unexpected collection far sooner than printing everything.
A watch expression shows what a name evaluates to in a chosen frame, while an assignment event shows when that value changes. Together they separate a local from the side effects of the calls used to update it. If candidate_records changes after fast_elements(), the interesting event may be in the collection operation rather than in the assignment itself. Emacs can present those events beside the relevant source lines for quick comparison.
Collections, Databases, and Live Context
Smallworld applications often pass collections, records, and transactional objects through methods that look narrow in source. A local may contain a transient vector, but the underlying data can come from a database transaction or a modelled collection. Visualising only the local loses that provenance; the display should also expose the collection class, element count, record identity, and relevant transaction context.
Collection analysis should be read-only by default. Expanding a property or filtering a preview can expose customer, spatial, or network data that is sensitive even when the debugging session is local. For production systems, use sanitised records or a controlled non-production dataset. An object inspector can then answer structural questions without turning a debugging aid into a data export.
This matters across the Australian market, where water, electricity, transport, and land-management organisations use geospatially aware Smallworld systems. Teams in Melbourne and Sydney may support the same operational data through different application configurations, so a variable view that exposes both runtime value and source scope becomes part of change assurance. It helps a reviewer ask whether a collection was transformed deliberately or replaced by an unintended empty or stale result.
After a fix, release evidence can be combined with browser-based test reports so the Magik debugging session and the wider application test suite tell a consistent story. These reports are complementary evidence, not a replacement for inspecting the local binding or debugger frame. Keeping that distinction clear prevents a green test summary from hiding an ambiguous data flow.
A Shared Visual Debugging Practice
A repeatable routine begins before the breakpoint. Enable semantic highlighting, inspect the method’s scope summary, and mark likely data transformations such as fast_elements(), filters, and record lookups. During execution, select the frame that owns the questioned value, capture its type and identity, then follow writes back to source. After the change, retain a sanitised trace that links the edited line to the observed value.
Code review can then discuss concrete data flow. Reviewers can ask whether a local still has a clear purpose, whether a parameter has been shadowed, or whether a collection is copied when the original must remain unchanged. Naming and scope conventions become easier to enforce when the editor exposes them beside the source. Code folding helps reviewers concentrate on the relevant transformation instead of scanning an entire method.
Teams can make the practice portable by using the same scope view in screen shares and saved debugging notes. A trace collected in Sydney should be readable by a colleague in Melbourne without relying on spoken context, while a support handoff from Perth or Brisbane can point directly to the declaration and frame. This is especially useful during Australian daylight-saving changes, when identical events may carry different clock offsets in a log.
Open a representative Magik method in your Magik Emacs setup, enable declaration highlighting and scope navigation, then pair a debugger session with a colleague during your next code review. HydePark Consulting can help teams standardise this workflow across Magik maintenance, training, and production support.
Core Features
Tab Mode & ECB
Quick tab switching and Emacs Code Browsing mode for navigating Magik codebases efficiently.
Magik Smeller
Code analysis tool that helps identify potential issues in Magik source files.
Code Folding
Hide/Show mode for collapsing and expanding Magik code blocks to focus on what matters.
Visual Bookmarks
Quick visual bookmarks for jumping between key locations in your Smallworld session buffers.
Object Inspector
Inspect Magik objects and display them in an Emacs Deep Print buffer for detailed examination.
Magik Debugger
Set breakpoints and monitor slots and variables directly from within Emacs.
Development Tools
Direct links between Emacs and the Smallworld Development Tools application, including Click Monitor.
Screen-casts & Tutorials
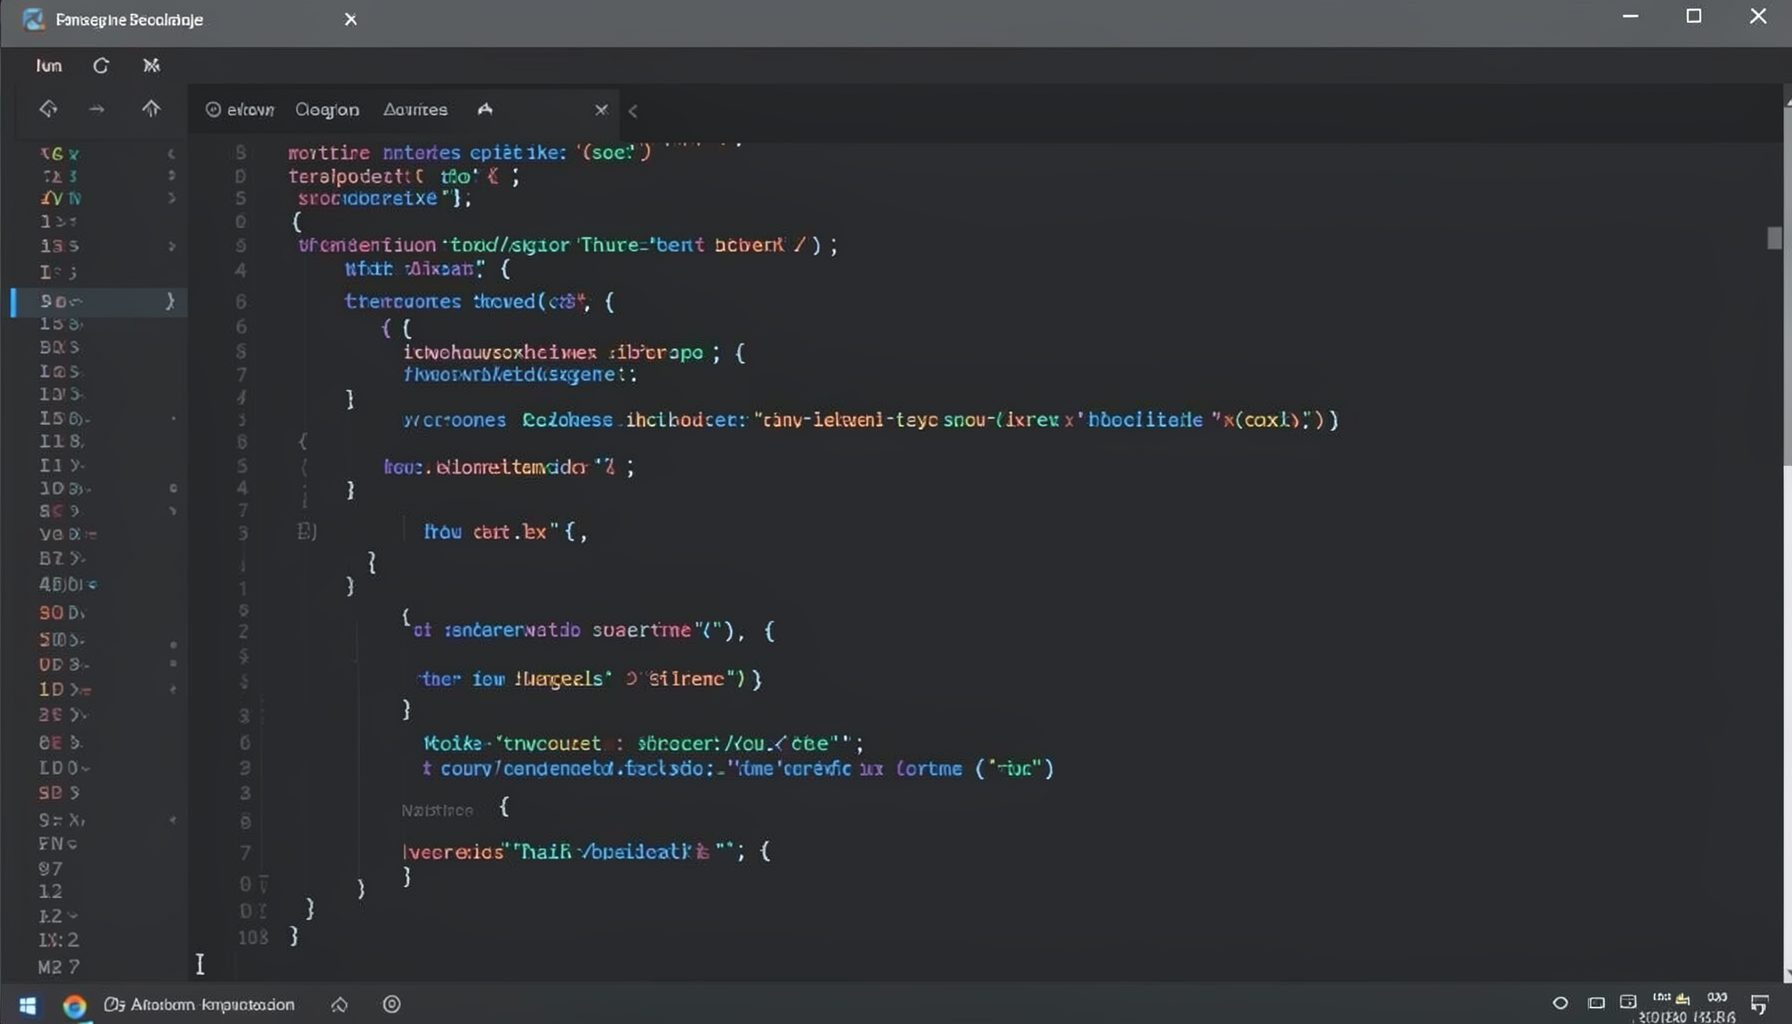
Screen-cast 1: Tab Mode, ECB & More
Covers tab-mode, ECB, Magik Smeller, code folding, visual bookmarks, pragma toggling, moving code, external editor, and MS Explorer.
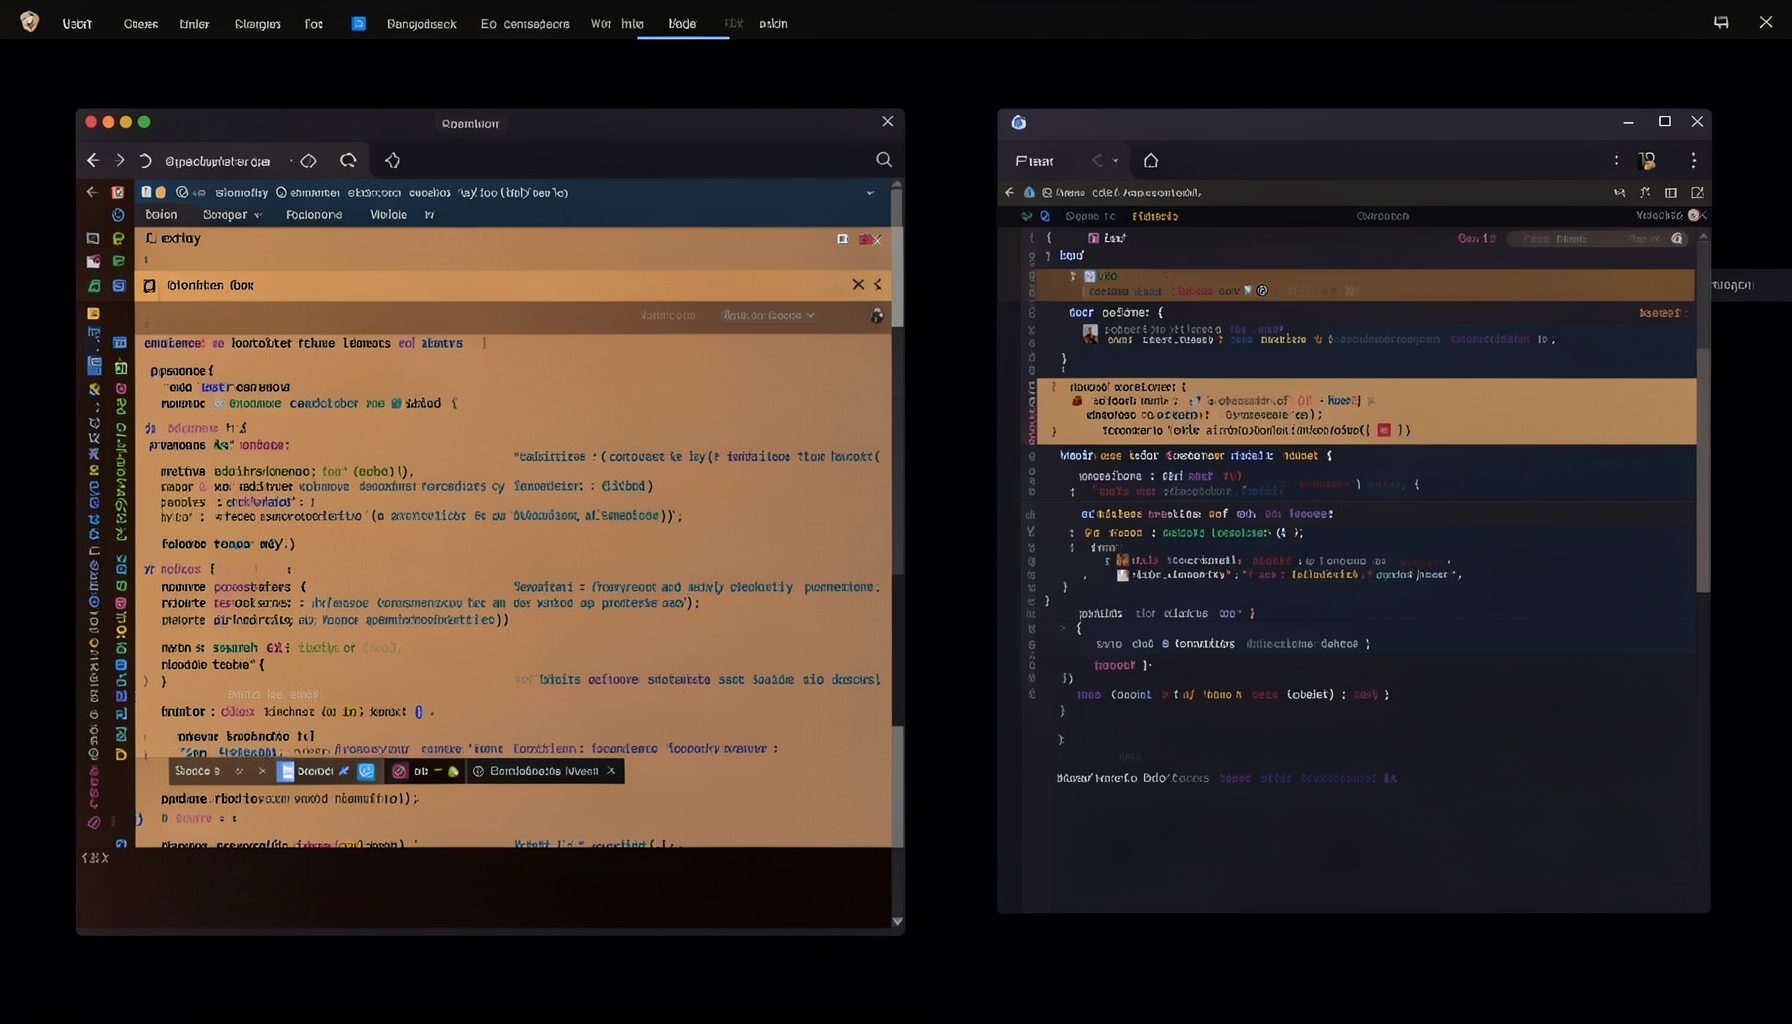
Screen-cast 5: Object Inspection & Deep Print
Inspect a Magik object, prompt for an expression evaluated within a Smallworld session, and display results in a Deep Print buffer.
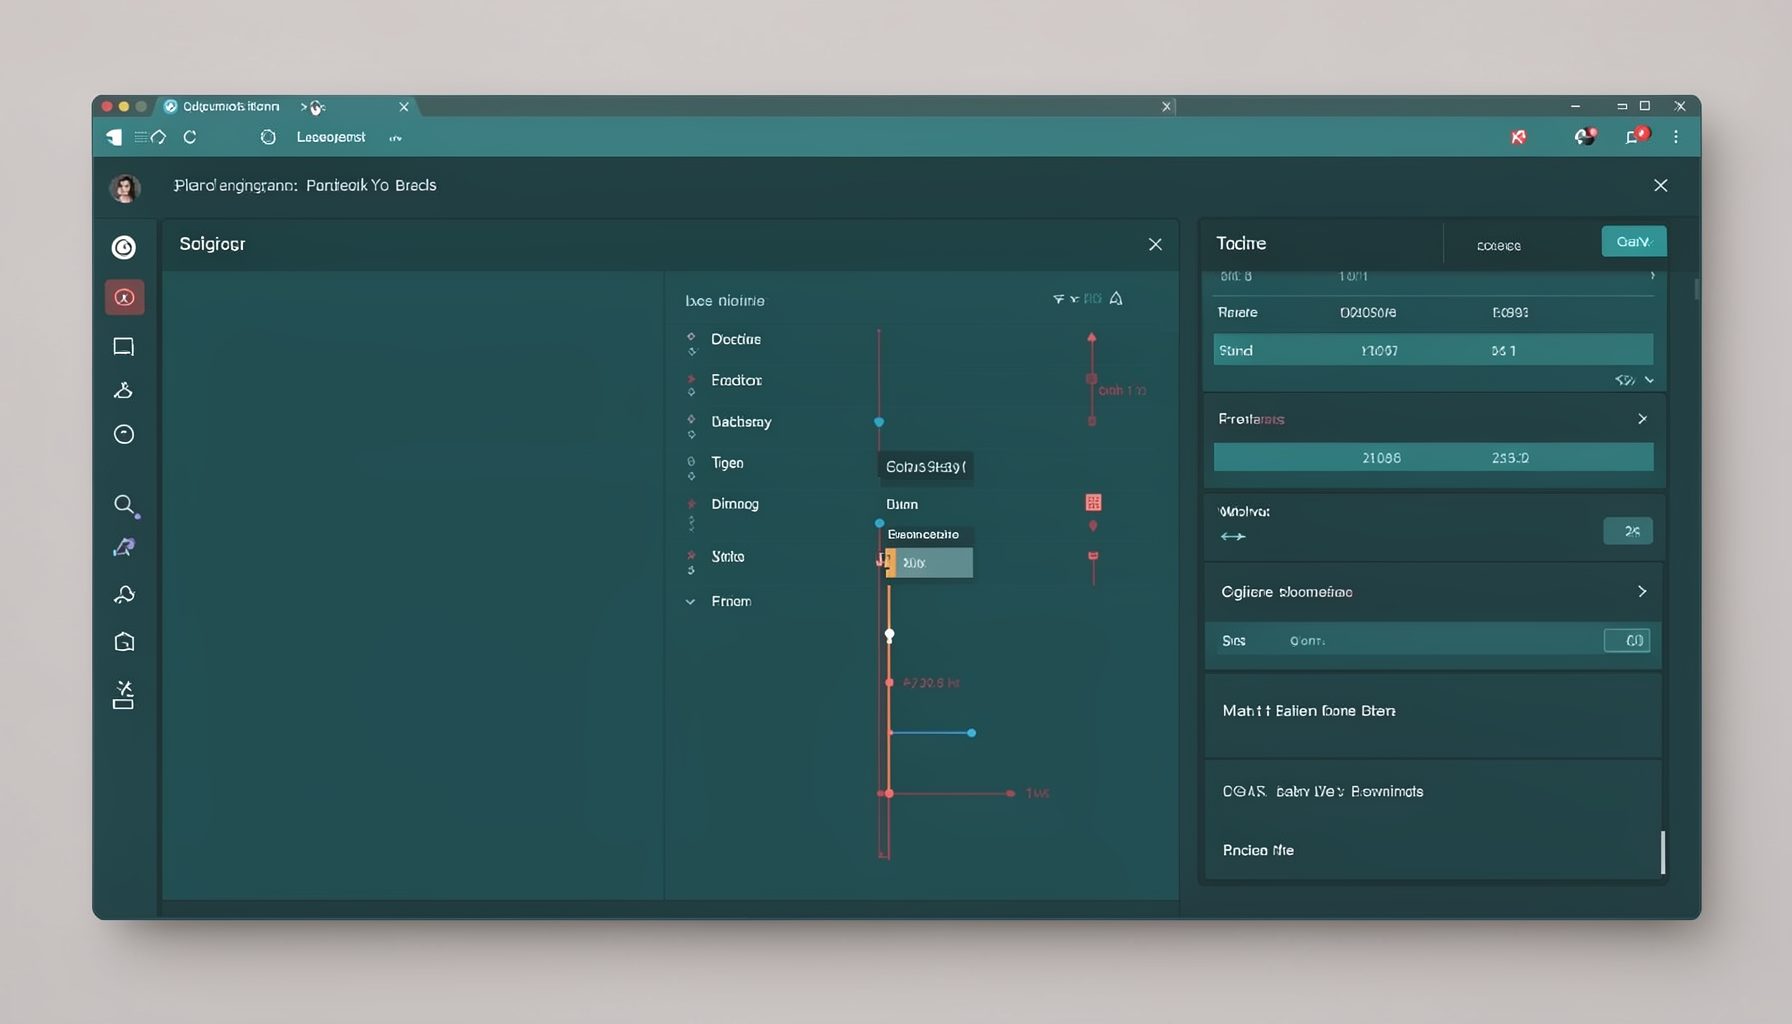
Screen-cast 7: Magik Debugger
Useful tools for application developers: Object Inspector and Magik Debugger with breakpoints and slot/variable monitoring.

Screen-cast 9: Tree Item GUI Control
Tree Item is a GUI control providing extensive facilities for displaying lists with rows, columns, trees, and in-place editing.