Emacs Extensions for
GE Smallworld Magik Development
Screen-casts, tutorials, and productivity tools for Magik programmers who use Emacs. From tab-mode and code folding to the Magik Debugger and object inspector — explore features built by a developer, for developers.
Learn MoreNine screen-casts published between November 2010 and January 2011 — covering everything from ECB mode to the Tree Item GUI control. Read the story behind the project →
Get in Touch
Using Edebug to trace Magik method calls in Emacs
When a Magik application behaves strangely, the visible failure is often several calls away from the real cause. A method may receive an unexpected object, a collection may be changed by a helper, or an Emacs command may send the wrong expression to the Smallworld session. Edebug gives you a controlled way to follow that activity inside Emacs, inspect values as they change, and stop at the point where the behaviour diverges.
There is an important boundary to understand first. Edebug is an Emacs Lisp debugger, so it directly traces Emacs Lisp functions rather than Magik methods executing inside the Smallworld runtime. Used carefully, however, it can trace the Emacs-side command, connection layer, evaluator, callback, and inspection tools that invoke Magik. For the runtime portion, combine Edebug with Magik’s own debugging or diagnostic facilities.
Understand the Emacs–Magik boundary
A typical Magik development session has several layers. You edit a method in a Magik buffer, invoke a command from Magik mode, send text through a connection to Smallworld, receive a result, and then display that result in a buffer or inspector. Edebug can instrument the Emacs Lisp functions responsible for these steps. It can show which arguments were sent, where control passed next, and what value came back from a process or callback.
It cannot see every internal method dispatch performed by the Magik virtual machine. If route_manager.find_route() calls three other methods inside Smallworld, Edebug will not automatically enter each of those runtime calls. You need Magik-side tracing, a breakpoint in the Smallworld debugger, temporary diagnostic output, or an instrumented wrapper for that part of the investigation.
This distinction prevents a common debugging mistake: placing an Edebug breakpoint on an Emacs command and assuming that a pause means the Magik method itself has stopped. The pause may occur before the request is sent, while a response is being decoded, or after the Magik process has already completed the work.
The most useful target is often the narrow bridge between the two environments. A function that builds a Magik expression, sends it to the running image, waits for a response, and returns the result provides a clear observation point. Instrument that function first, then move closer to the Magik runtime only when the evidence requires it.
Instrument the functions that send Magik code
Open the Emacs Lisp source that implements the command or connection feature. Place the cursor inside the function you want to inspect and run M-x edebug-defun. Edebug instruments the definition, and the next call enters the debugger. You can also evaluate an instrumented definition from a development buffer, depending on the conventions used by the package and your Emacs configuration.
For example, a Magik integration might contain an Emacs Lisp function with a shape similar to this:
(defun my-magik-evaluate (expression)
  (let ((request (my-magik-format-request expression)))
    (my-magik-send request)
    (my-magik-read-result)))
Instrumenting my-magik-evaluate lets you inspect expression, request, and the value returned by my-magik-read-result. Step into my-magik-format-request if the outgoing text is malformed. Step over the process call if the transport is known to work, then inspect the response parser when the result shown in Emacs does not match the result printed by Smallworld.
At an Edebug stop, the current source line is highlighted and the mode line indicates that execution is paused. The stepping keys can vary slightly with Emacs customisation, but the usual controls include SPC to advance, n to move to the next stopping point, g to continue, and q to leave the session. Press ? while stopped to display the available commands for your version.
Arguments and local bindings are particularly valuable when tracing generated Magik code. A command may appear to request gis_program_manager.current_program, while the formatter has added quoting, a wrapper, or a different receiver. Use Edebug’s expression evaluation command to inspect values in the current environment. Check the exact string sent to the process rather than relying on the source form shown in the buffer.
If the function is called repeatedly, set a breakpoint at the branch that matters instead of stepping through every request. A conditional breakpoint or a temporary guard in the Emacs Lisp wrapper can restrict attention to a particular method name, class, or object identifier. Remove the instrumentation after the investigation so normal interactive work is not slowed by unnecessary debugger stops.
Follow a method call from the editor
A reliable trace begins with a reproducible action. Suppose selecting a method and pressing a navigation command opens the wrong definition. Start with the interactive command bound to that action, then step through the functions that identify the symbol, search the current Magik buffer, and construct the destination location. This reveals whether the problem is in parsing, name resolution, file discovery, or window management.
Method navigation tools often distinguish between a method name, a class name, a package, and a receiver expression. Inspect each representation as it moves through the Emacs Lisp call chain. A value that begins as vehicle_speed may become a qualified selector, a regular expression, or a search request. Edebug makes these transformations visible without requiring broad logging throughout the extension.
For runtime investigation, place the Edebug stop around the function that submits a Magik expression. The expression can call a small Magik helper that reports the receiver, method selector, and selected arguments before invoking the real method. This creates a useful hand-off: Edebug proves what Emacs sent, while Magik diagnostics prove which method executed and with which objects.
For example, a temporary Magik diagnostic wrapper can record a method entry and exit, then delegate to the original implementation. Keep such wrappers narrowly scoped and clearly temporary. Method redefinition can affect a shared development image, and a wrapper that changes error handling or return values can create a second problem that obscures the first.
The same workflow helps with collection analysis. If an Emacs inspector displays an empty collection, stop at the request builder and then at the response decoder. Check whether the collection was empty in Smallworld, serialised incorrectly, truncated by the transport, or converted into an unexpected Emacs Lisp representation. This is often faster than repeatedly evaluating the same expression from a scratch buffer.
Inspect callbacks, errors, and asynchronous results
Synchronous evaluation is straightforward: the command sends text and waits for a result. Asynchronous integrations require more care because the function that starts a request may return before the Magik response arrives. Instrument the process sentinel, filter, callback, or queue dispatcher that handles the later event. The important call may occur in a different dynamic context from the command that initiated it.
When Edebug stops in a callback, inspect the process object, accumulated output, request identifier, and parsed payload. A partial response can look like a valid Magik value if the parser is called too early. A stale callback can also update the wrong buffer or display the result of an earlier request. Recording a request identifier at both send and receive points makes these mix-ups easier to identify.
Error handling deserves separate attention. An Emacs Lisp condition may be raised while reading the process, while parsing an error response, or while displaying a Magik object. Step through the handler rather than immediately continuing. Inspect the original condition, the raw response, and any transformed message presented to the user. A polished error message can hide the useful class or method information needed to locate the runtime failure.
Do not automatically catch every error during a trace. Broad handlers may convert a meaningful failure into a generic “evaluation failed” message and leave Edebug with little context. Temporarily narrow the handler, or add a breakpoint before the condition is transformed. Once the cause is understood, restore the package’s normal error behaviour.
Emacs packages can also use timers, process filters, and hooks. A method call may appear to finish correctly, then fail when a hook refreshes an inspector buffer. Instrument the hook or refresh function if the visible symptom occurs after the response has arrived. This is especially useful for extensions that combine code folding, object inspection, and method navigation in a single workflow; the final display may involve several callbacks after evaluation has ended.
Make traces useful in Australian development teams
A trace should be short enough to read and safe enough to share. Avoid copying complete process buffers into tickets when they contain customer records, network details, or proprietary application data. Under the Australian Privacy Act 1988, organisations handling personal information need appropriate safeguards and governance. Magik diagnostics can expose addresses, asset identifiers, user names, or database values even when the original bug appears to concern only a method call.
Teams in Sydney, Melbourne, Brisbane, and Adelaide often work across different project environments and support windows. Include the Emacs version, package revision, Smallworld version, local time zone, and whether the session was connected to a development, test, or production image. A timestamp in AEST or AEDT is more useful than “this morning”, particularly when a Perth-based support engineer or an offshore team is comparing process logs.
Latency can also affect the trace. A developer connected from Perth to an environment hosted on the east coast may see delayed asynchronous responses, while a Melbourne office may reproduce the issue quickly on the same network. Record whether the session used a local image, a remote desktop, a VPN, or a direct connection. The delay may expose a race in callback handling rather than a fault in the Magik method.
Before sharing a trace externally, redact source paths, connection strings, tokens, and business data. Australian organisations commonly align operational controls with the Essential Eight, and debugger output should be treated as diagnostic data rather than harmless text. Keep a private full trace when necessary, but circulate a sanitised version for code review or vendor support.
A repeatable trace file is valuable for teams that work around end-of-financial-year releases or tightly scheduled transport and utilities projects. Capture the exact command, the input object or a safe substitute, the outgoing Magik expression, the relevant callback, and the runtime-side result. This creates a compact record that another developer can replay without guessing which buffer, image, or branch was active.
Build a repeatable debugging workflow
Begin by reducing the problem to one command and one method call. Confirm the failure outside Emacs if possible, then run the same operation through the editor. This separates a Magik runtime defect from an integration defect before you spend time instrumenting the wrong layer.
Next, instrument the smallest Emacs Lisp function that crosses the boundary into Smallworld. Inspect the method selector, receiver expression, arguments, generated text, and returned value. Step into formatting or parsing functions only when one of those values is wrong. This keeps the call stack readable and avoids turning every editor action into a debugging session.
When the request is correct, add Magik-side diagnostics around the suspected method chain. Record entry and exit, important argument properties, collection sizes, and exception details rather than dumping entire objects. Compare the runtime record with the Edebug view. If both agree, move the investigation to state, database access, or method dispatch. If they differ, concentrate on encoding, quoting, buffering, or asynchronous handling.
After fixing the defect, remove temporary wrappers and Edebug instrumentation. Re-run the original reproduction, then test a nearby case: another receiver, an empty collection, a failed lookup, and a slower response. A debugging change that works for one method can still break navigation or inspection for another. The core Emacs features available in a Magik-focused setup can help you combine folding, navigation, evaluation, and inspection into a consistent test routine.
Keep a small internal playbook containing the relevant commands, package source locations, transport functions, and safe diagnostic patterns. New developers can then trace a Magik request without placing breakpoints randomly across the editor. Over time, this turns Edebug from an emergency tool into a practical way to understand and maintain the Emacs integration.
Instrument the Emacs-side boundary, verify the generated Magik request, and pair the trace with focused runtime diagnostics. That combination gives Magik developers a clear path from an editor action to the method that actually ran. Apply the workflow to a reproducible development case, record a sanitised trace, and add the useful findings to your team’s Magik and Emacs documentation.
Core Features
Tab Mode & ECB
Quick tab switching and Emacs Code Browsing mode for navigating Magik codebases efficiently.
Magik Smeller
Code analysis tool that helps identify potential issues in Magik source files.
Code Folding
Hide/Show mode for collapsing and expanding Magik code blocks to focus on what matters.
Visual Bookmarks
Quick visual bookmarks for jumping between key locations in your Smallworld session buffers.
Object Inspector
Inspect Magik objects and display them in an Emacs Deep Print buffer for detailed examination.
Magik Debugger
Set breakpoints and monitor slots and variables directly from within Emacs.
Development Tools
Direct links between Emacs and the Smallworld Development Tools application, including Click Monitor.
Screen-casts & Tutorials
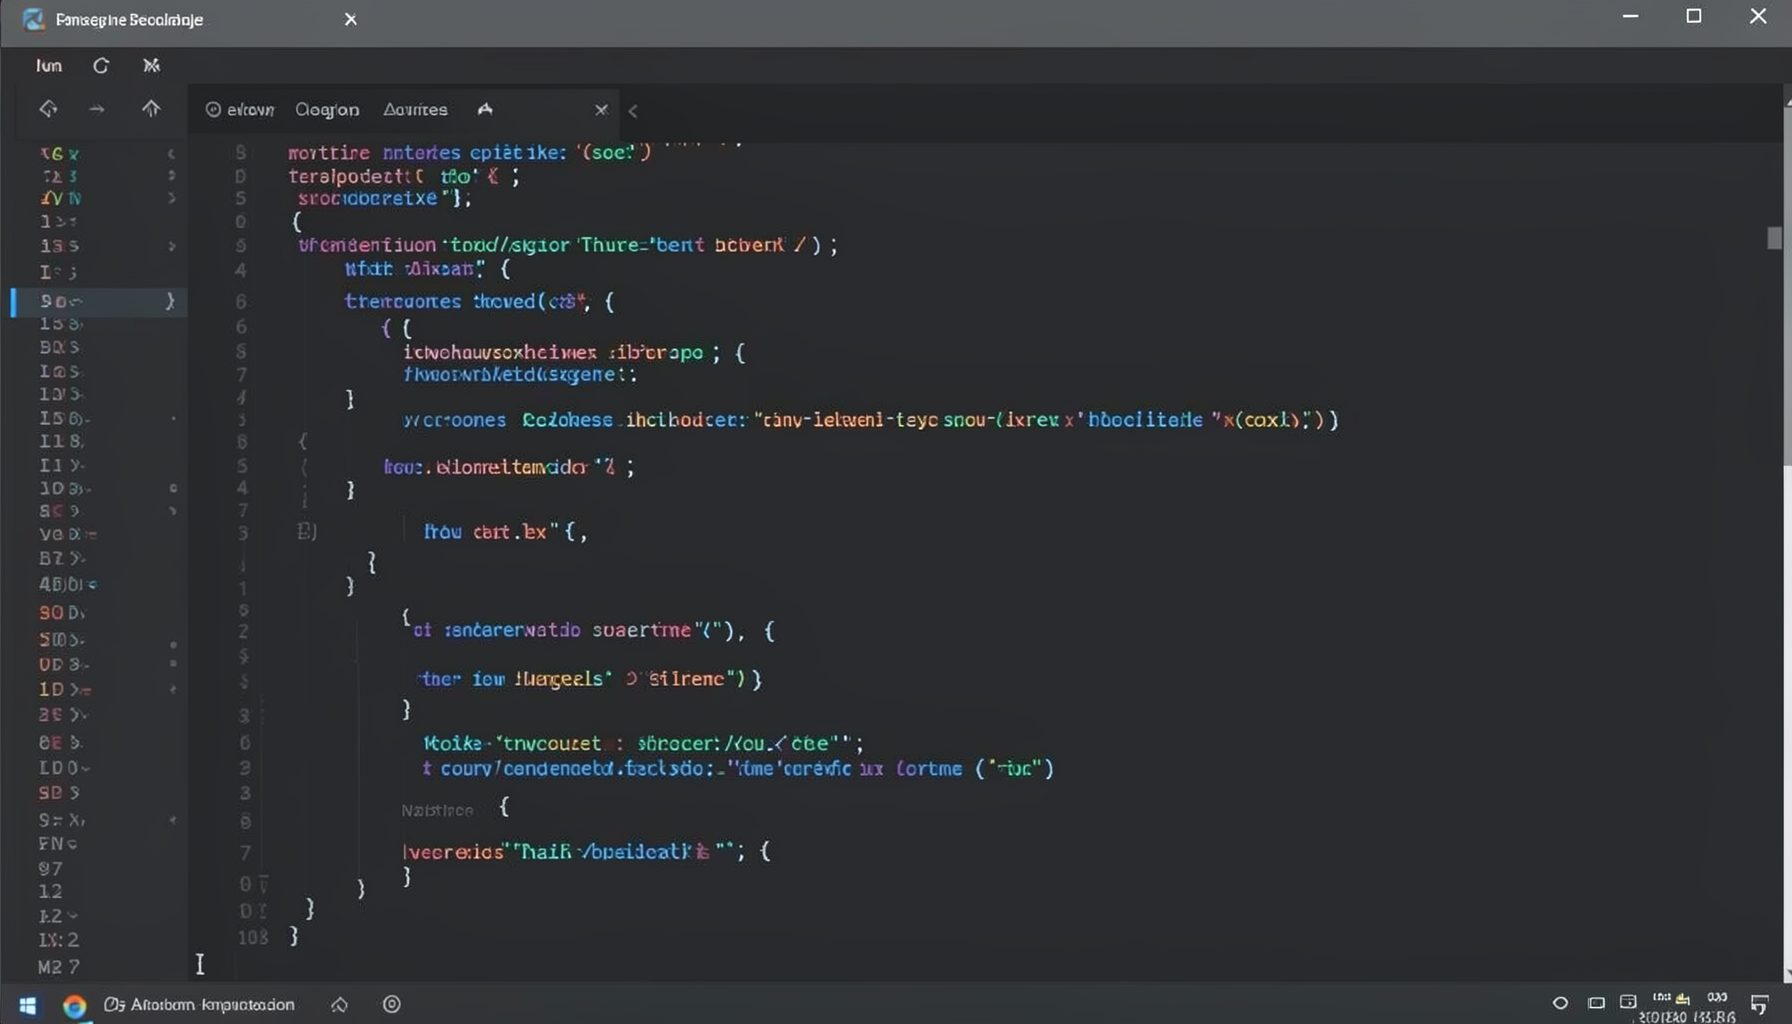
Screen-cast 1: Tab Mode, ECB & More
Covers tab-mode, ECB, Magik Smeller, code folding, visual bookmarks, pragma toggling, moving code, external editor, and MS Explorer.
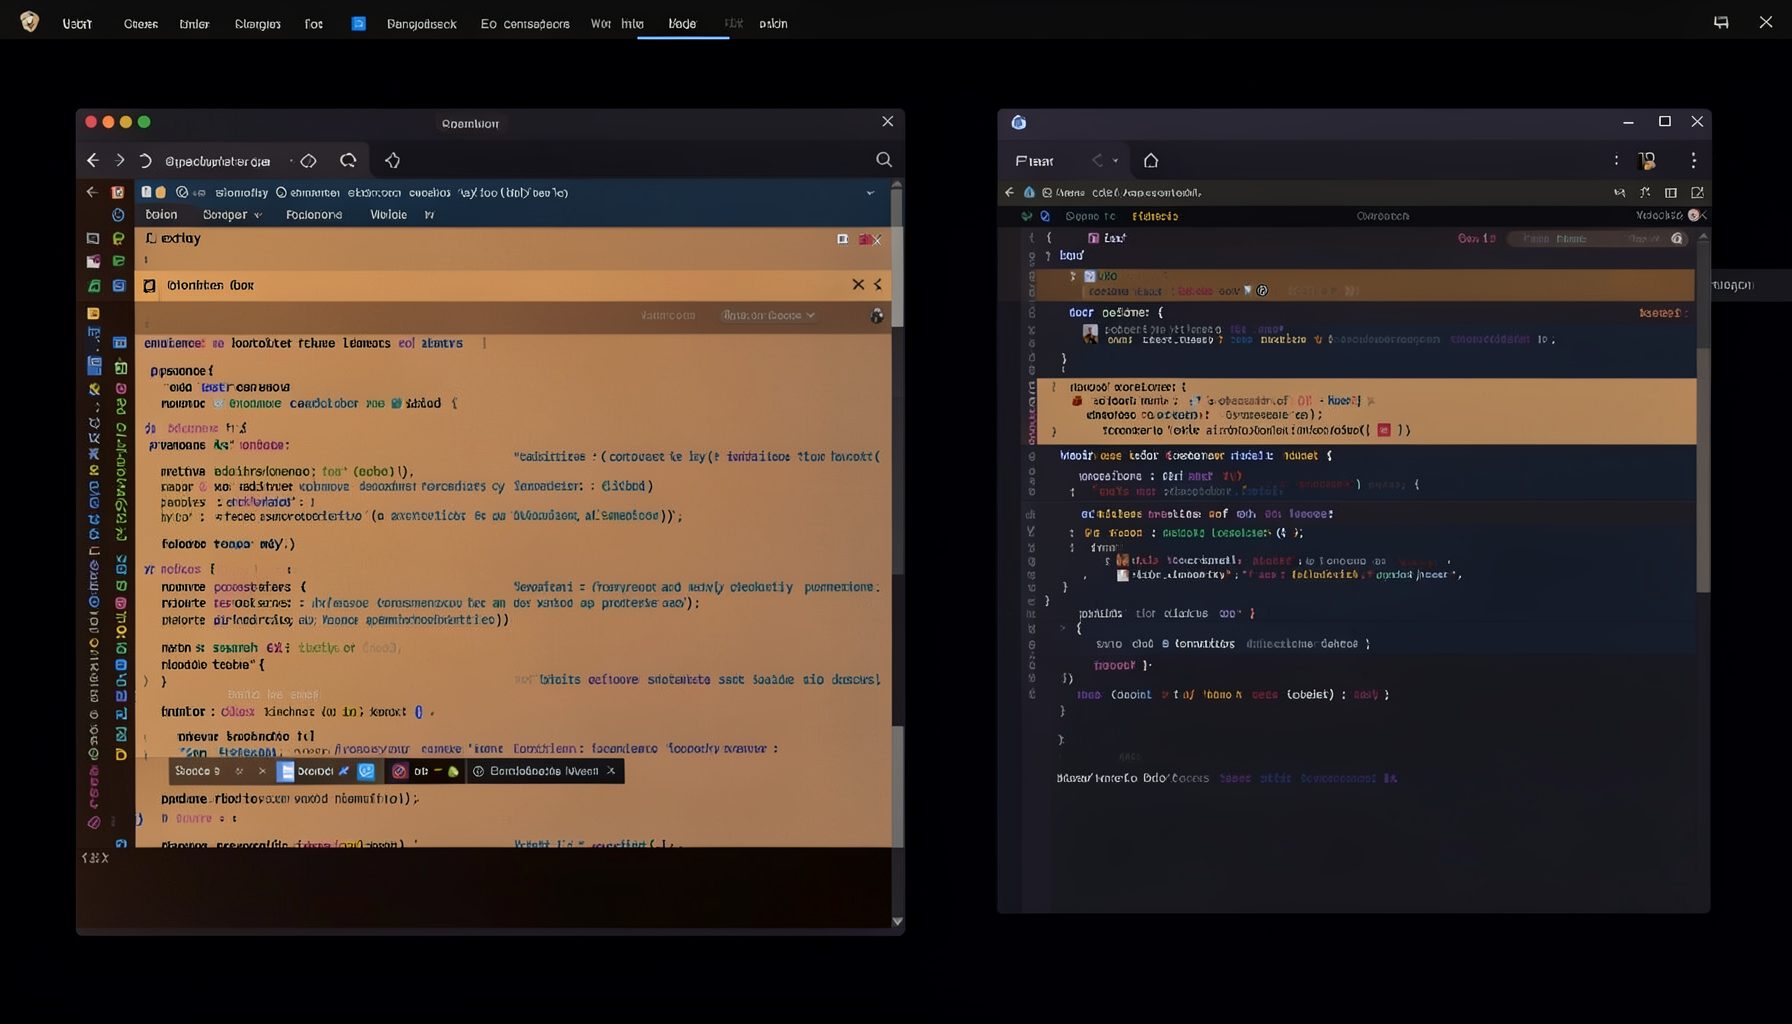
Screen-cast 5: Object Inspection & Deep Print
Inspect a Magik object, prompt for an expression evaluated within a Smallworld session, and display results in a Deep Print buffer.
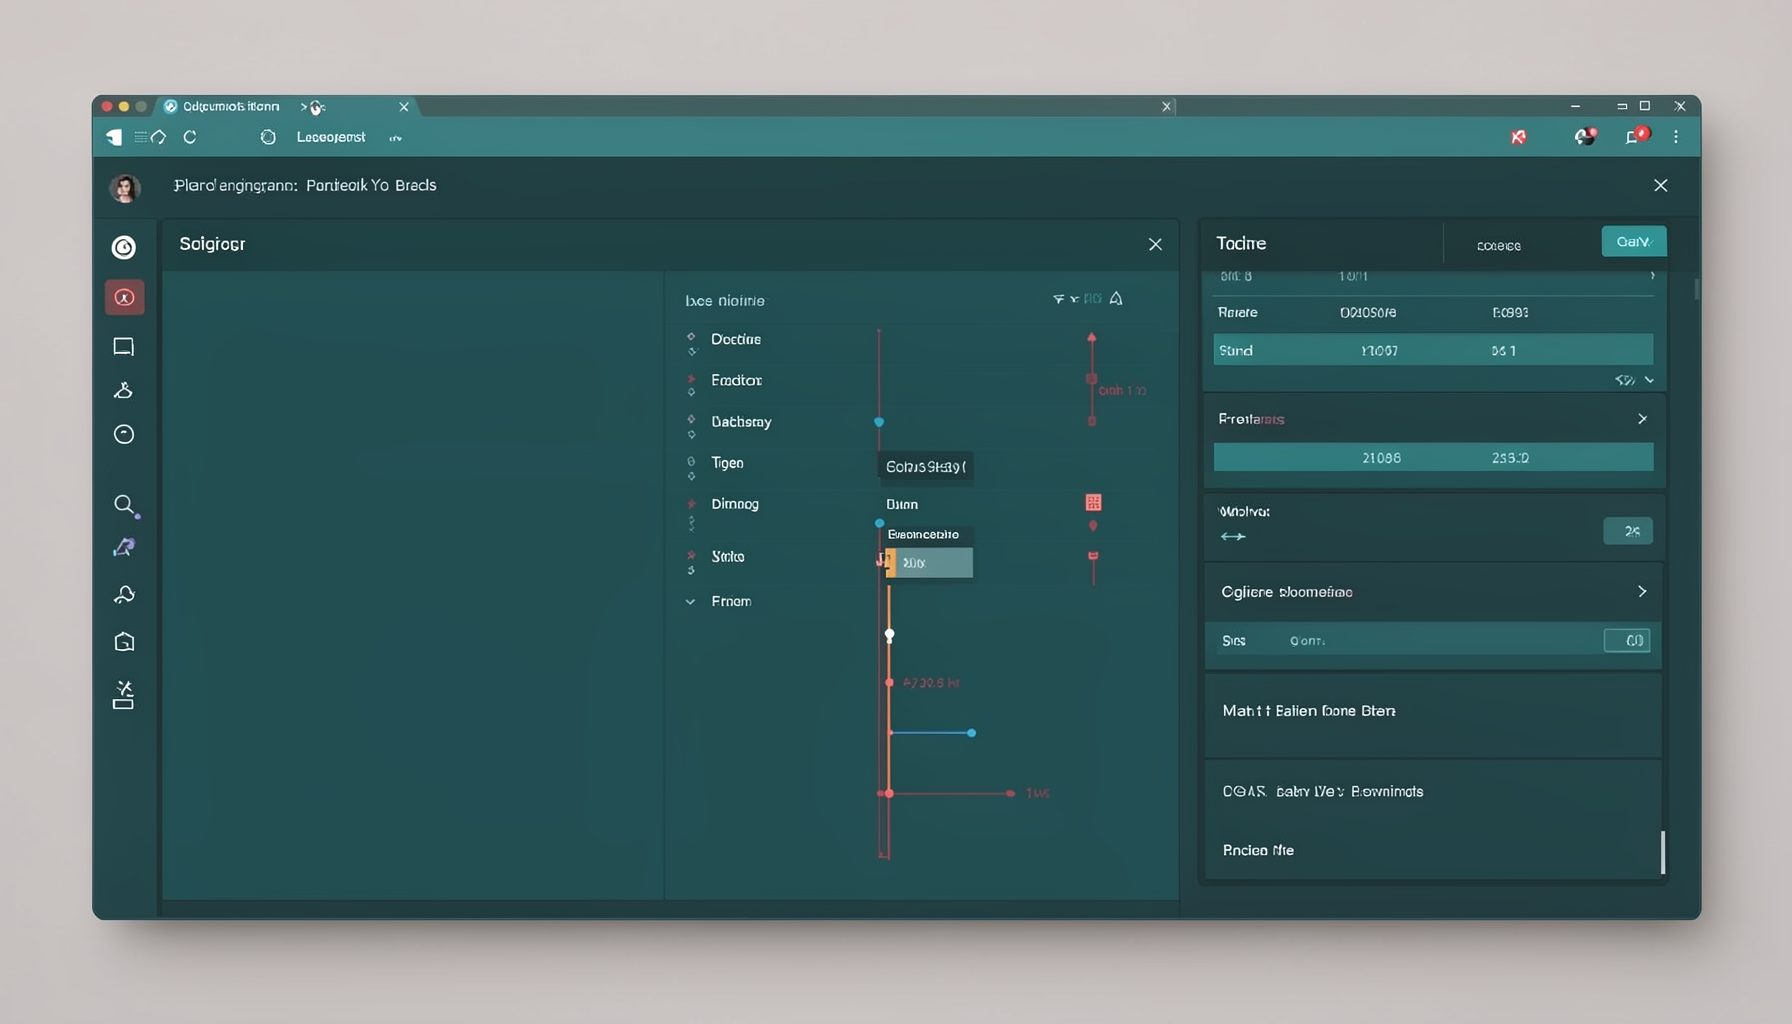
Screen-cast 7: Magik Debugger
Useful tools for application developers: Object Inspector and Magik Debugger with breakpoints and slot/variable monitoring.

Screen-cast 9: Tree Item GUI Control
Tree Item is a GUI control providing extensive facilities for displaying lists with rows, columns, trees, and in-place editing.